This annual bulletin presents key statistics on the characteristics of qualifying defence contracts (QDCs) and qualifying sub-contracts (QSCs). For the first time, statistics on contractor compliance with statutory reporting requirements are included in the bulletin. The statistics provide transparency on the significant amount of defence capabilities that are procured non-competitively. The statistics can inform policy, regulatory and investment decisions aimed at improving value for money and fair and reasonable prices within the Single Source Regulatory Framework.
The data in this bulletin is sourced from statutory reports submitted by defence contractors to the Single Source Regulations Office (SSRO), which provide information on QDCs/QSCs and the companies involved in delivering them. A number of changes to the statistics were introduced this year, following discussions with stakeholders on user needs. The new section on ‘Compliance with reporting requirements’ incorporates the previously separate SSRO Annual Compliance Bulletin into the bulletin. New statistics on the use of components, the total estimated price of contracts broken down by price band, and a pricing method breakdown for average profit rates have been introduced, as well as active/completed contract breakdown for many statistics. Some statistics which are not commonly used have been removed, as well as some breakdowns by financial year.
Key contract statistics are presented for contracts that became QDCs/QSCs between 1 April 2015 (the start of the financial year in which contract reports were first submitted) and 31 March 2026. The SSRO was notified of 863 contracts that became QDCs/QSCs between 1 April 2015 and 31 March 2026. The contract statistics are based on QDCs/QSCs with submitted contract reports as of 30 April 2026, as contractors have one month after the date the contract becomes a QDC/QSC to submit initial reports. There were 798 QDCs/QSCs with submitted contract reports as of 30 April 2026.
Data for both QDCs and QSCs are reported in these statistics. The total price of all QDCs/QSCs includes QSC prices counted both within the ‘parent’ QDC price and separately, to present data on the price of all contracts subject to the Single Source Contract Regulations 2014. QDC and QSC prices are also reported separately in the ‘Price and pricing method’ section of this bulletin.
Statistics on contractor compliance with statutory reporting requirements, including the timeliness and quality of reports, relate to contract and supplier report submissions due by 30 April 2026. Data presented is as of 31 May 2026, to allow a month for the Ministry of Defence (MOD) and the SSRO to review the reports and establish their quality. Where available, time series data is also shown from 1 May 2018, when compliance data was first collected in the reporting system.
These statistics present the latest reported data about QDCs/QSCs and are expected to change, for example when updated or corrected contract reports are submitted describing the latest contract position, or highlighting contract extensions or amendments. Statistics may be subject to change until contract completion reports are received. Similarly, compliance statistics are not static as reports can be submitted late or suppliers can provide corrected or updated reports with new data. The statistics represent a snapshot in time and are correct as of data extraction.
The bulletin contains statistics under the following sections:
- Number, duration and SME involvement
- Price and pricing methods
- Profit
- Outturn price in completed contracts
- Compliance with reporting requirements
- Notes to the statistics
Key Statistics
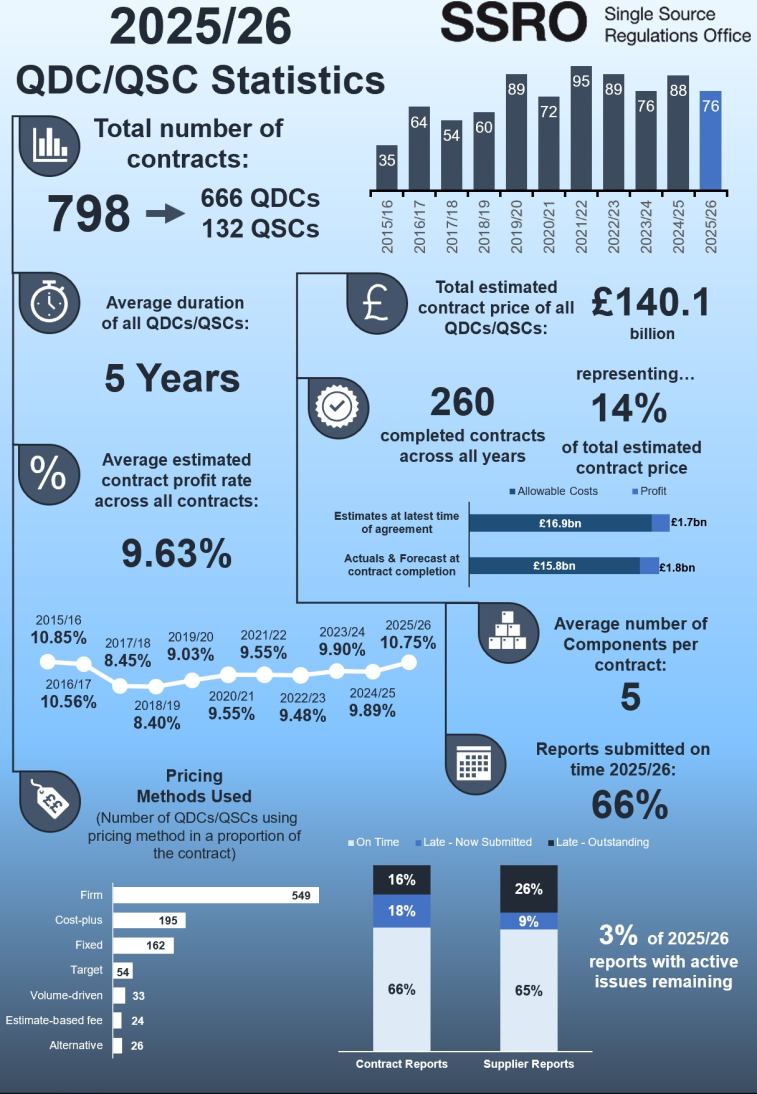
In the financial year between 1 April 2025 and 31 March 2026:
- There were 76 new QDCs/QSCs (58 QDCs and 18 QSCs).
- The total estimated price of these QDCs/QSCs was £3.9 billion (£3.3 billion of QDCs and £0.6 billion of QSCs).
- The mean estimated contract profit rate was 10.75 per cent. The agreed contract profit rates ranged from 6.4 per cent to 15.4 per cent.
- Two thirds (66 per cent) of reports due in 2025/26 were submitted on time.
- 3 per cent of reports contained active compliance issues as of 31 May 2026, better than the KPI target of 5 per cent.
Between 1 April 2015 and 31 March 2026:
- There were 798 contracts that became QDCs/QSCs (666 QDCs and 132 QSCs).
- The total estimated contract price of these QDCs/QSCs was £140.1 billion (£128.9 billion of Allowable Costs, and £10.7 billion of profit and £0.6 billion of costs indistinguishable from profit).
- The mean estimated contract profit rate for these QDCs/QSCs was 9.63 per cent.
- Of the 798 contracts that became QDCs/QSCs in this period, 260 contracts have now completed, representing 14 per cent of the total estimated contract price for all QDCs/QSCs (£19.1 billion).
Trends and changes
- The total estimated price of the 76 new QDCs/QSCs in 2025/26 was the lowest initial estimated total contract price for any financial year since 2017/18 (contracts in previous years may have been amended, extended or submitted corrected reports, meaning they are now showing higher estimated prices than in their initial year of reporting).
- Five per cent of all QDCs/QSCs (by number) hold 72 per cent of the estimated contract price.
- Firm pricing continues to be the most used pricing method each year, in terms of the number of QDCs/QSCs using each pricing method. The new alternative pricing methods introduced in April 2024 have been used in 26 contracts.
- For new QDCs/QSCs in 2025/26, the average (mean) contract profit rate at the latest time of agreement was 10.75 per cent, an increase of 0.86 percentage points compared to an average of 9.89 per cent in 2024/25 QDCs/QSCs. The range of estimated profit rates for 2025/26 contracts was from 6.4 per cent to 15.4 per cent.
- A third (33 per cent, 260 contracts) of all contracts that became QDCs/QSCs have now completed. Sufficient price information submitted for 248 contracts showed a 5 per cent decrease in the total actual/forecast contract price when compared to the estimated price at the latest time of agreement. This consists of a £1.08 billion reduction in Allowable Costs, and a £68 million increase in profit.
- In 2025/26, there were 18 new QSCs, which is the second highest number of QSCs entered into in any single financial year to date (after 2024/25).
- The number of contract and supplier reports due for submission in 2025/26 increased by 6 per cent overall from 2024/25.
- The timeliness of contract and supplier reports decreased slightly (from 70 in 2024/24 to 66 per cent in 2025/26) and remains below the SSRO’s Key Performance Indicator (KPI) target of 75 per cent. Completion reports saw the greatest year-on-year decline in on-time submissions, decreasing from 72 per cent in 2024/25 to 44 per cent in 2025/26.
Number, duration and SME involvement
Number and average duration of QDCs/QSCs, the number of QDCs/QSCs contracted to SMEs, numbers of sub-contracts and numbers of components.
Summary
- In 2025/26 there were 76 new QDCs/QSCs (58 QDCs and 18 QSCs).
- Since 1 April 2015, 798 contracts became QDCs/QSCs (666 QDCs and 132 QSCs).
- A third of these 798 QDCs/QSCs have since completed (260 QDCs/QSCs).
- These QDCs/QSCs were with 237 different contracting companies, and 178 Global Ultimate Owners (GUOs).
- 28 of these 798 QDCs/QSCs were with contracting companies that self-identified as a small or medium enterprise (SME).
- The average (mean) estimated contract duration was 5.0 years across all QDCs/QSCs.
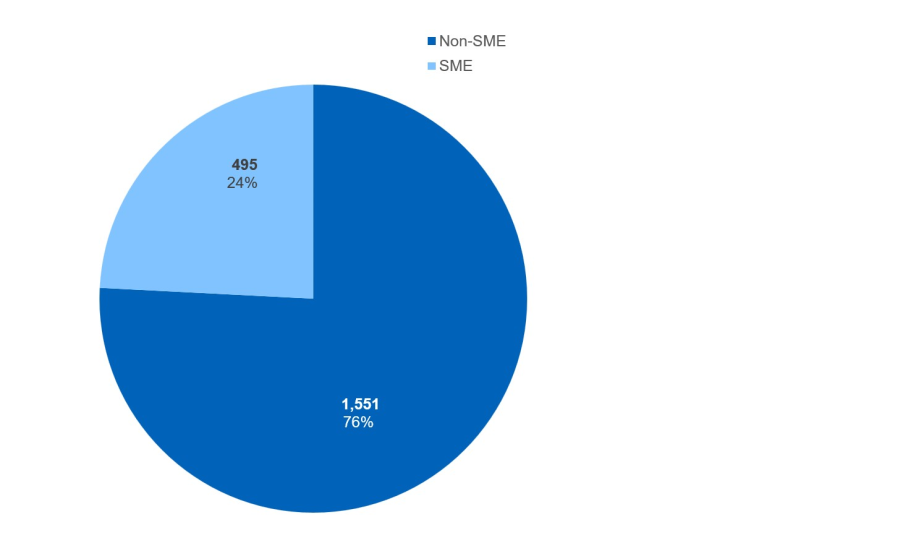
There are 2,046 sub-contracts with a value of £1 million or more, and 24 per cent of them are with companies identified as SMEs.
Figure 1: Number of QDCs/QSCs by financial year in which contract became QDC/QSC
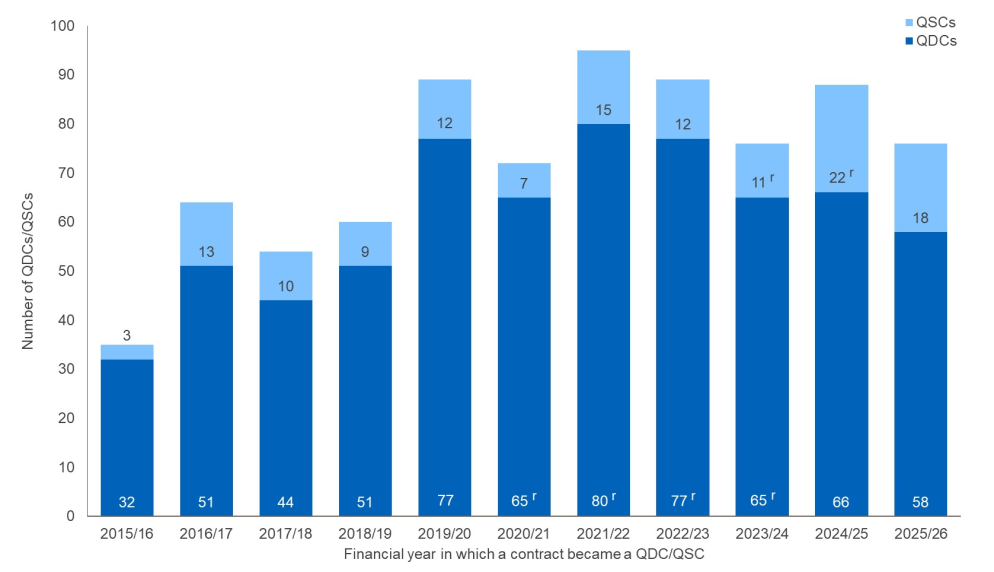
As of 30 April 2026, contractors had submitted reports for a total of 798 QDCs/QSCs (666 QDCs and 132 QSCs). Figure 1 breaks this down to show the number of new QDCs/QSCs each year. There were 76 new QDCs/QSCs in 2025/26 compared to 88 QDCs/QSCs in 2024/25.
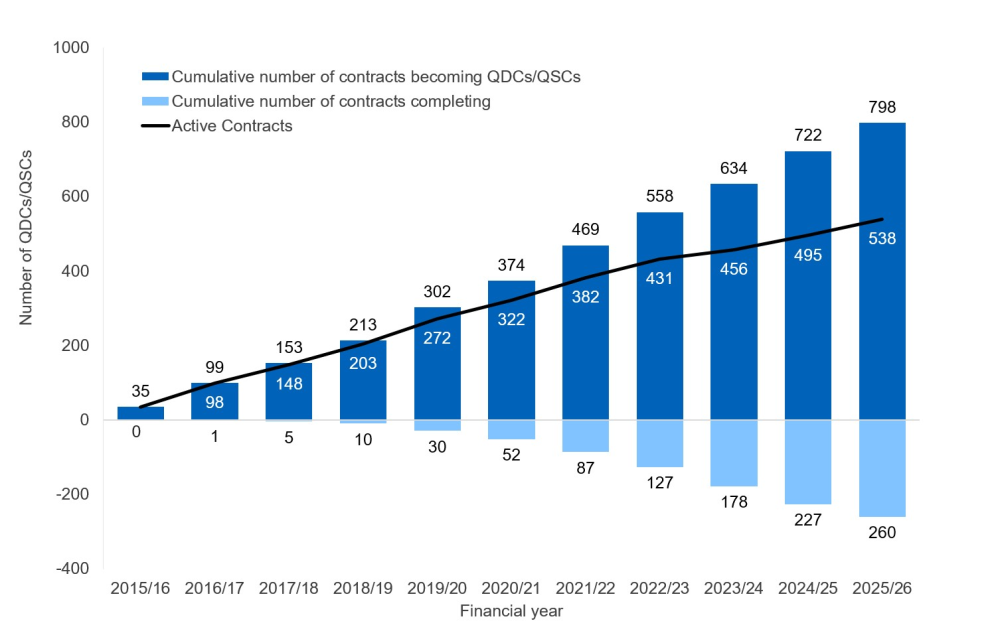
Figure 2 below shows the number of contracts which became QDCs/QSCs in each year, split between those that have completed and those that are still active. For the purposes of these statistics, a completed contract is defined as a contract with a submitted Contract Completion Report (CCR), which is due six months after contract completion. If the CCR has not been submitted, then a contract is defined as ‘active’. Please refer to the Methodology section for further details on how completed contracts are defined. Since 1 April 2015, 260 of the 798 QDCs/QSCs have completed.
The number of completed contracts below provides an indication of how ‘final’ the data reported for each year is. The majority of QDCs/QSCs are still active, and so will provide further contract update reports with potentially revised data which will be reflected in subsequent bulletins.
Figure 2: Stock of active and completed QDCs/QSCs, by financial year in which the contract became a QDC/QSC
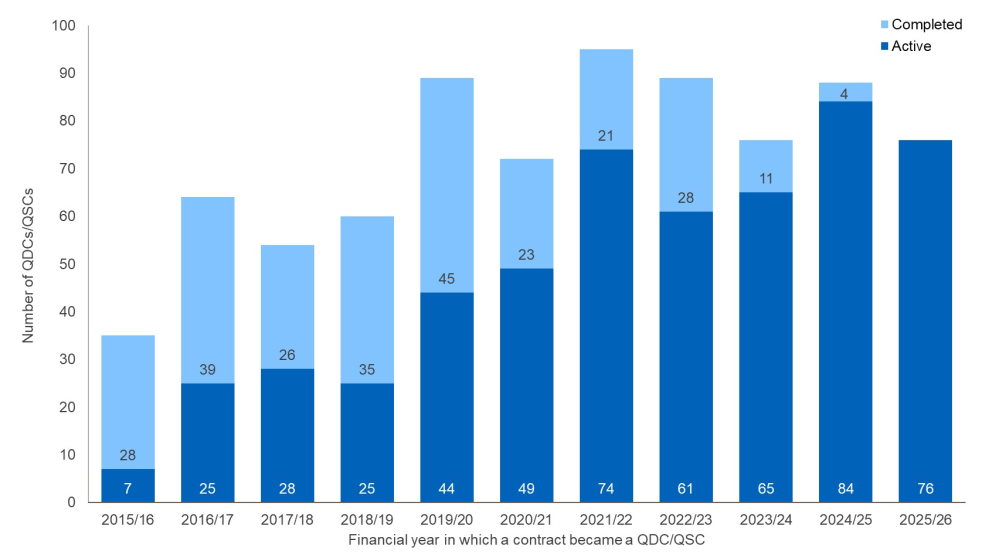
Figure 3 shows the cumulative flow of contracts becoming QDCs/QSCs, and those completing in each year, with active contracts shown as the net of these. It can help with understanding the number of active contracts subject to the regime. Currently, of the 798 contracts which became QDCs/QSCs, 538 are still considered active.
Figure 3: Cumulative flow of contracts which became QDCs/ QSCs and completed and stock of active contracts
Duration
The duration data in this section is based on estimated contract duration at the latest reporting date. The actual duration determined when the contract completes may differ from this estimated contract duration. The estimated contract duration presented is the time between the date the contract became a QDC/QSC, and the expected contract completion date. Where a contract has completed, the estimated contract duration presented represents the time between the date the contract became a QDC/QSC and its actual contract completion date.
Table 1 shows the average (mean) estimated duration of all 798 contracts at 5.0 years. QDCs have an average duration of 4.9 years, whilst QSCs have an average of 5.6 years. Since the threshold for contracts to become QSCs is £25 million, compared to QDCs which is £5 million, this could explain why the average duration for QSCs is higher than QDCs. When broken down by contract status, active contracts have an average duration of 5.7 years and completed contracts have an average duration of 3.6 years.
Table 1: Average (mean) estimated contract duration of QDCs/QSCs by contract type and contract status
| Contract type | Average duration (years) |
| QDC | 4.9 |
| QSC | 5.6 |
| Contract status | Average duration (years) |
| Active QDCs/QSCs | 5.7 |
| Completed QDCs/QSCs | 3.6 |
| All QDCs/QSCs | 5.0 |
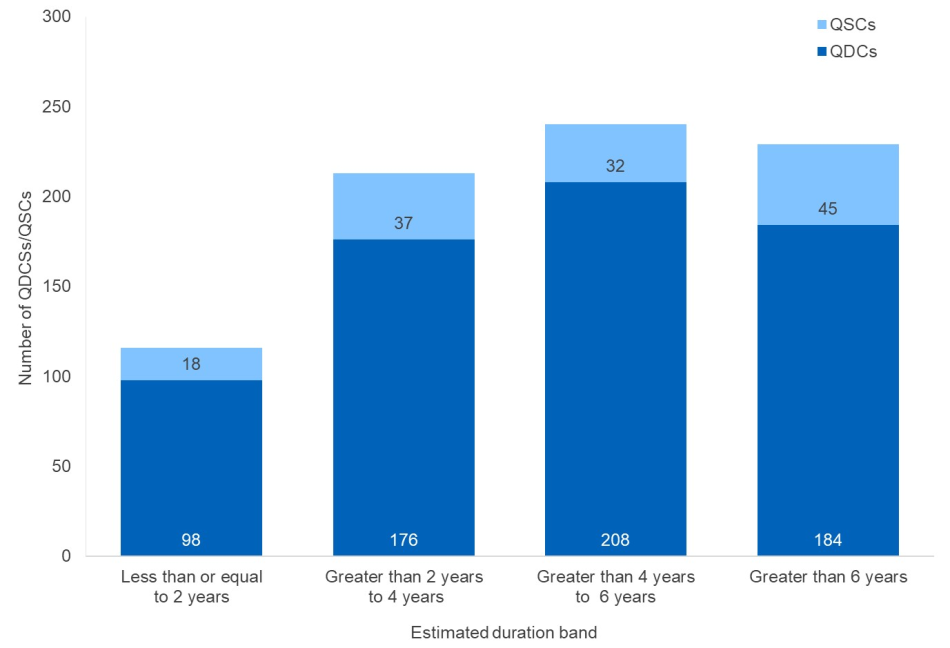
Figure 4 shows the estimated duration of all 798 QDCs/QSCs. The majority of these contracts (469 QDCs/QSCs; 59 per cent) have a duration of over four years. Please see the accompanying databook for a breakdown by contract status. As contracts mature, they can be amended and extended, so the estimated duration of older contracts tends to be longer than for newer contracts. The estimated duration of a contract can continue to change throughout the contract’s life; the actual duration will be reported when the contract is complete.
Figure 4: Number of QDCs/QSCs by estimated duration for all QDCs/QSCs
Small and Medium-Sized Enterprises (SMEs) and Subcontracts
Four per cent (28 QDCs/QSCs) of the 798 QDCs/QSCs were contracted with small or medium enterprises (SMEs), as self-reported by the contracting companies. The total number of SMEs has reduced since the previous annual bulletin, as this data is self-reported by the contracting companies, and contractors can update their SME status in subsequent report submissions. The SSRO has not assessed the data submitted to determine whether the contractor or sub-contractor was correct to conclude it falls within the definition of SME as set out in regulation 2 of the Single Source Contract Regulations 2014. Please see the accompanying databook for a breakdown by contract status.
Figure 5 shows that across all QDCs/QSCs there were 2,046 sub-contracts with a value of £1 million or more reported to the SSRO since 1 April 2015. Given only contracts with a value of £1 million or more are reported, this data will not represent the entirety of sub-contracts involved in the delivery of QDCs/QSCs. Of these sub-contracts, 24 per cent are with companies identified as SMEs by the parent contractor. The databook also provides a breakdown by active/completed status of the parent QDC/QSC, as well as the average (mean) price of sub-contracts.
Figure 5: Number of reported sub-contracts with a value of £1 million or more by SME status
Note: The SME status of a contractor or sub-contractor uses data as submitted by the contractors themselves; no verification on whether these align to the definition of an SME as required by the Single Source Contract Regulations 2014 has taken place for the purposes of this analysis.
Contracting companies and Global Ultimate Owners
Table 2 shows how many unique contracting companies and Global Ultimate Owners (GUOs) the QDCs/QSCs were contracted to, by financial year. As of 30 April 2026, the 798 QDCs/QSCs were awarded to 237 different contracting companies, which in turn are owned by 178 unique GUOs. For more details on how the contracting company and GUO are sourced, please refer to the methodology section. The accompanying databook also provides a breakdown by QDC/QSC, and by contract status.
Table 2: Number of unique Contracting Companies and Global Ultimate Owners that have QDCs/QSCs, by financial year in which their first contract became a QDC/QSC
| Financial year in which contract became a QDC/QSC | Cumulative number of contracting companies | Cumulative number of GUOs | ||
| 2015/16 | 23 | 18 | ||
| 2016/17 | 53 | 40 | ||
| 2017/18 | 77 | 55 | ||
| 2018/19 | 102 | 76 | ||
| 2019/20 | 127 | 95 | ||
| 2020/21 | 146 | 111 | ||
| 2021/22 | 162 | 122 | ||
| 2022/23 | 186 | 138 | ||
| 2023/24 | 203 | 152 | ||
| 2024/25 | 218 | 165 | ||
| 2025/26 | 237 | 178 | ||
Components
The requirement to report on the components of contracts was introduced into the Single Source Contract Regulations from 1 April 2024. A component of a contract is a part of a contract that is treated distinctly from other such parts in determining the price payable under a contract. For example, components will exist where different contract pricing methods are used for different parts of a contract, or where different contract profit rates apply to different parts of the contract. Components have similar, but not identical, reporting requirements to the overall contract, and the SSRO is keeping the reported component data under review before deciding if any further statistics can be presented on components in this bulletin.
Table 3 shows that as of 30 April 2026, the SSRO had been notified of 646 components of which 537 (83 per cent) had submitted at least one report. The average number of components per QDC/QSC, excluding contracts that have not reported any components, is 5.
Table 3: Total number of contracts reporting components, number of components that have submitted a report, and average number of components per contract with components
| Number of contracts reporting components | Number of components with a submitted report | Average number of components per contract with components |
| 102 | 537 | 5 |
Price and pricing methods
Total estimated contract price of QDCs/QSCs, split by Allowable Costs and profit, the contract pricing methods employed, price of sub-contracts and components.
Summary
- Since 1 April 2015, the total estimated price of all QDCs/QSCs was £140.1 billion (£128.9 billion of Allowable Costs, £10.7 billion of profit and £0.6 billion of price where costs are indistinguishable from profit).
- The total estimated price of new QDCs/QSCs in 2025/26 was £3.9 billion (£3.3 billion of QDCs, £0.6 billion of QSCs).
- Of the £140.1 billion of total estimated contract price, £19.1 billion (14 per cent) is with contracts that have now completed.
- The mean estimated contract price of all active contracts was £225 million, whilst the mean estimated contract price of all completed contracts was £73 million.
- Across all years, the majority (70 per cent) of the 788 QDCs/QSCs that submitted pricing method data used firm pricing as the pricing method in all or a proportion of the contract.
The data presented in this section is based on the estimated contract price at the latest time of agreement (either the date the contract became a QDC/QSC, or the date of the latest pricing amendment) and does not necessarily represent the price once the contract is complete, nor the estimated price when the contract was first entered into. The total price of all QDCs/QSCs includes QSC prices counted both within the ‘parent’ QDC price and separately, to present data on the price of all contracts subject to the Single Source Contract Regulations.
The contract price statistics reported in previous bulletins were mostly the sum of the Allowable Costs and profit. From 1 April 2024, contracts may be priced using alternative pricing methods in some cases where costs and profits may not be determined or identified separately for the purposes of pricing the contract. In this bulletin, contracts or components where costs and profit are indistinguishable are now included in the price statistics.
Since 1 April 2015, the total estimated price of all QDCs/QSCs was £140.1 billion (£128.9 billion of Allowable Costs, £10.7 billion of profit and £0.6 billion of costs indistinguishable from profits). Of this, £19.1 billion (14 per cent) is with contracts that have now completed. The remaining active contracts account for £121.1 billion of the total contract price, which is still subject to change, due to potential future amendments, report corrections or extensions. See Figure 7 for a breakdown by financial year.
Table 4: Estimated stock of total contract price of QDCs/QSCs, split by estimated cost, profit and alternative pricing where costs are indistinguishable from profit
| Cost / price element | Active Contracts (£m) | Completed Contracts (£m) | Total Amount (£m) |
| Allowable Costs | 111,360 | 17,491 | 128,851 |
| Profit | 9,155 | 1,565 | 10,720 |
| Allowable Costs + Profit | 120,515 | 19,057 | 139,572 |
| Indistinguishable costs & profit | 566 | 0 | 566 |
| Total | 121,081 | 19,057 | 140,138 |
Figure 6 shows the total estimated price of contracts by the year in which they became a QDC/QSC, split by contract type. The total estimated contract price for new QDCs/QSCs in 2025/26 was lower than in the previous year, at £3.9 billion in 2025/26 compared to £14.1 billion in 2024/25. When comparing to previous bulletins, this was the lowest initial estimated total contract price for any financial year since 2017/18 (contracts in previous years may have been amended, extended or submitted corrected reports, meaning they are now showing higher estimated prices than in their initial year of reporting). Differences in the annual total estimated contract price are influenced by the number and price of contracts which became new QDCs/QSCs each year, as well as amendments to existing QDCs/QSCs affecting previous years’ reported figures. A small number of high value contracts can therefore have a substantial effect on the total. Please note that the total estimated contract price may sometimes include costs incurred before a contract became a QDC/QSC (‘sunk costs’).
Across all QDCs/QSCs in all financial years, the majority (£130.2 billion; 93 per cent) of the total estimated contract price is associated with QDCs, with seven per cent (£10.0 billion) of the estimated contract price from QSCs. In 2025/26, sixteen per cent of the estimated price was associated with QSCs.
Figure 6: Estimated stock of total contract price of QDCs/QSCs by financial year in which contract became a QDC/QSC, split by contract type
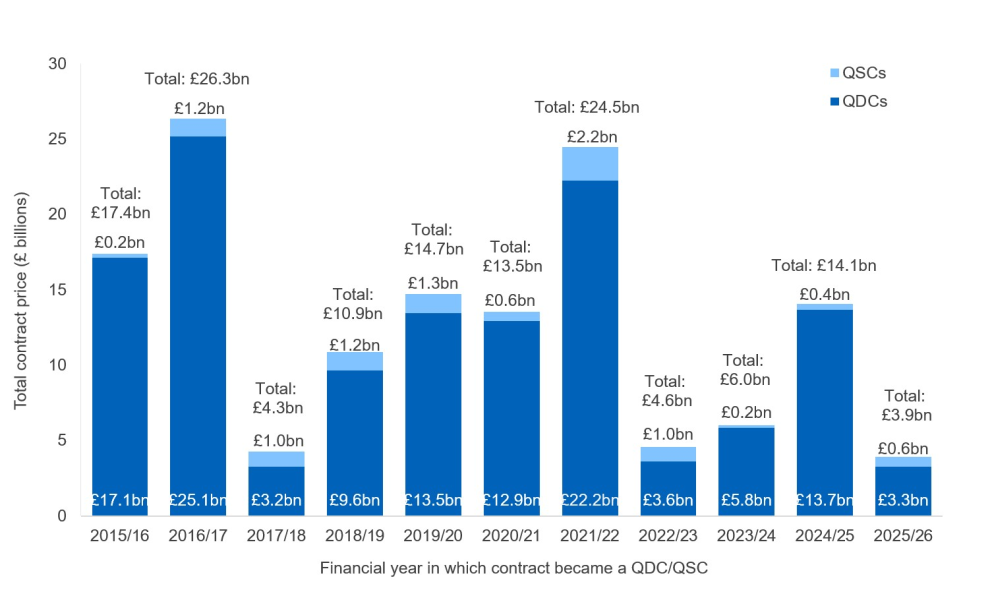
Figure 7 below shows the cumulative price of contracts becoming QDCs/QSCs and the cumulative price of contracts completing in each financial year, with the net of the two being the ‘active’ contracts in that year. Due to data suppression in prior years, data is only shown from 2022/23 onwards. As of the end of 2025/26, there is £121.1 billion worth of QDCs/QSCs that are still considered active.
Figure 7: Cumulative flow of the estimated price of all and completed QDCs/QSCs and stock of active contracts
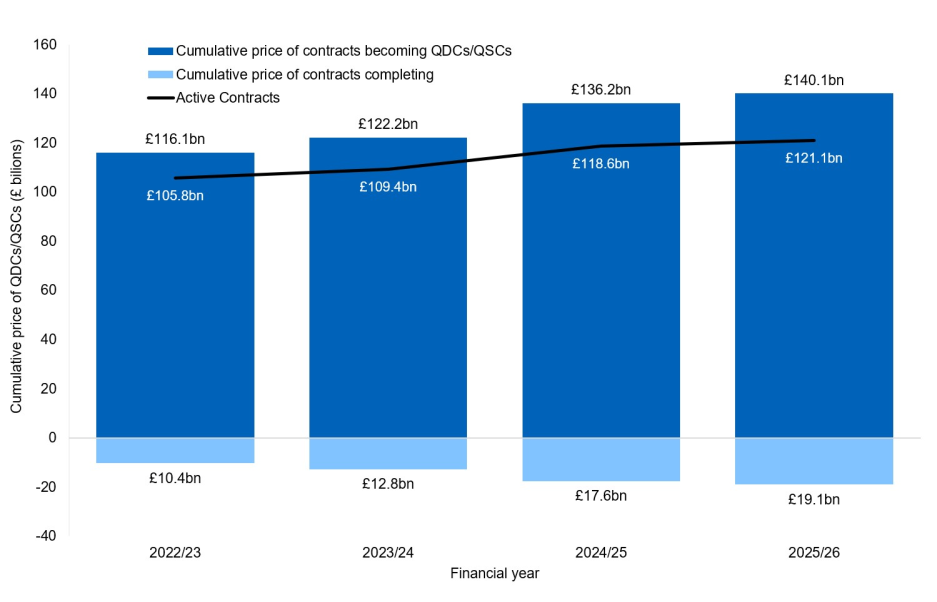
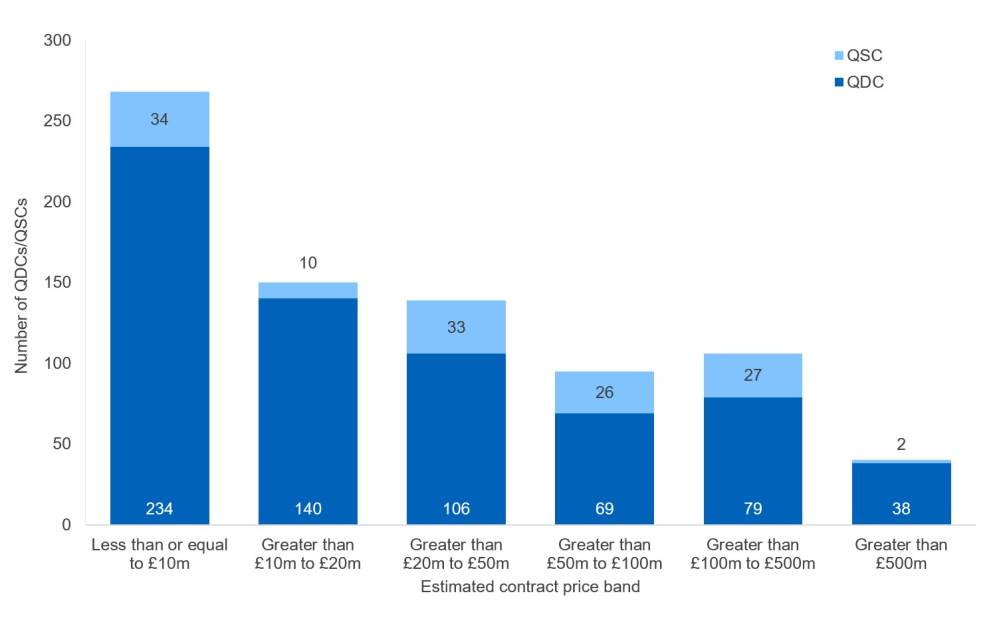
Figure 8 shows the number of QDCs/QSCs by price band for all QDCs/QSCs. For QDCs, the lower price bands of ‘less than or equal to £10m’ and ‘greater than £10m to £20m’ were the two most common price bands. There is a contract value threshold of £25m for a sub-contract to become a QSC, and so there are greater proportions of QSCs within the higher price bands than the lower bands. The value is determined in accordance with Regulation 5 of the Single Source Contract Regulations, and this is distinct from the contract price, which is determined in accordance with Regulation 10 or one of the alternative pricing methods (Regulations 19A to 19G). Some QSCs may therefore have a contract price of less than £25 million and still be assessed as a QSC.
Figure 8: Number of QDCs/QSCs by estimated contract price, by contract type
Conversely, Figure 9 shows the total contract price of QDCs/QSCs by price band. The majority of the total contract price sits within the ‘greater than £500m’ price band. Combining the statistics from Figure 8, this shows that five per cent of the QDCs/QSCs hold 72 per cent of the estimated contract price.
Figure 9: Contract price of QDCs/QSCs by estimated contract price
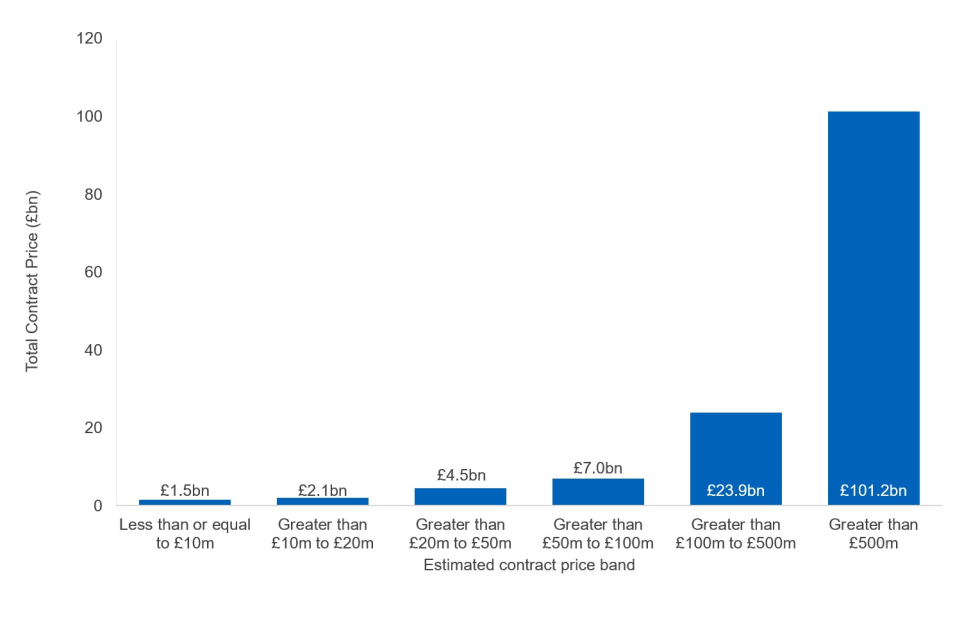
Table 5 shows the mean and median estimated contract prices, by contract type, and contract status. For all QDCs/QSCs, the mean estimated contract price is £176 million, and the median price is £18 million. The median contract price is much lower than the mean, as there are a smaller number of large contracts that tend to skew the mean upwards. The mean contract price of active contracts (£225 million) is higher than for completed contracts (£73 million). Active contracts also have a higher average duration than completed contracts (see Table 1) which may explain their higher mean price.
Table 5: Mean and median estimated contract price, by contract type, and contract status
| Contract type | Mean contract price (£m) | Median contract price (£m) | ||
| QDC | 195 | 18 | ||
| QSC | 76 | 18 | ||
| Contract status | Mean contract price (£m) | Median contract price (£m) | ||
| Active | 225 | 18 | ||
| Completed | 73 | 18 | ||
| All QDCs/QSCs | 176 | 18 | ||
Pricing methods
Regulation 10 of the Single Source Contract Regulations 2014 specifies six default pricing methods that can be used to determine the price payable for a QDC/QSC. The method used to price a QDC/QSC may influence the final price and profit payable, and the incentive to control costs. The six default pricing methods are as follows:
- Firm pricing;
- Fixed pricing;
- Cost-plus pricing;
- Estimate-based fee pricing;
- Volume-driven pricing; and
- Target pricing.
From 1 April 2024, the Regulations were amended to allow for new alternative pricing methods to be used in QDCs/QSCs in particular circumstances. These are intended to be used in circumstances where application of the pricing formula may not be possible or because a fair price can be satisfactorily established by other means. This includes, for example, where prices are already regulated or where there is a market price which can act as a reference (‘Commercial pricing’). The number of contracts utilising these alternative pricing methods to date is low, and so they have all been grouped into an ‘alternative pricing method’ group for the purposes of the statistics that follow in this section, including those reported under Regulation 19G ‘Aggregation of Components’. Ten contracts did not provide any pricing method data and so have been excluded from analysis in this section.
Figure 10 shows how many QDCs/QSCs used one, two, or three or more pricing methods in the pricing of their contract. Out of the 788 QDCs/QSCs where pricing method data was provided, the majority (585 QDCs/QSCs; 74 per cent) reported using just one pricing method in the pricing of the contract, whilst 164 QDCs/QSCs used two pricing methods (21 per cent) and 39 QDCs/QSCs used three or more pricing methods (5 per cent).
Figure 10: Number of QDCs/QSCs that have used 1, 2 and 3 or more pricing methods in the contract
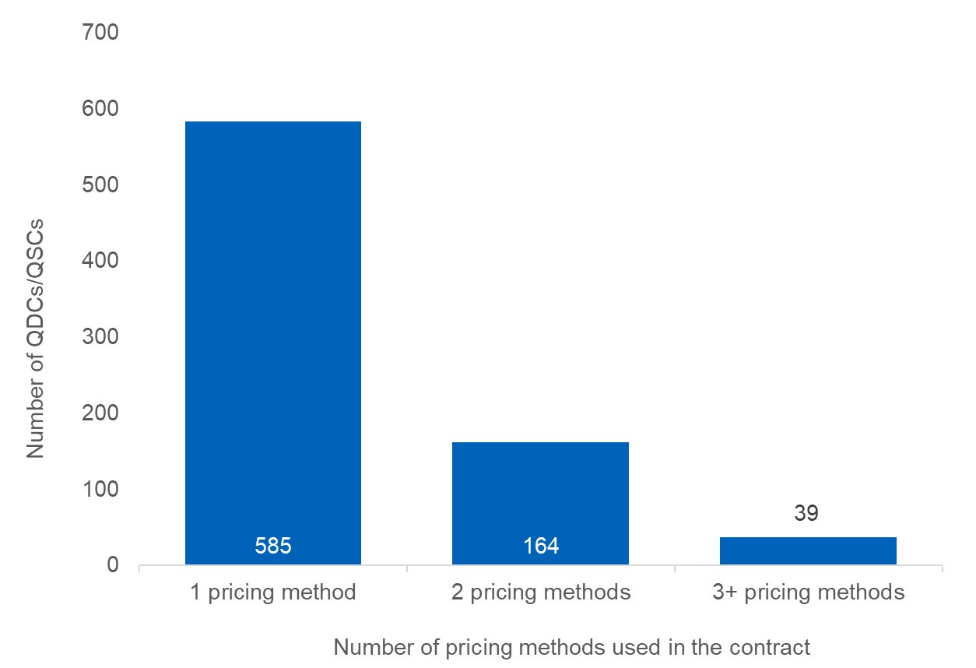
Figure 11 presents the number of QDCs/QSCs that used each of the pricing methods in a proportion of the contract. The single most reported pricing method across all QDCs/QSCs was firm pricing, with 549 out of 788 QDCs/QSCs (70 per cent) using this pricing method within the contract (sometimes in combination with other pricing methods). Firm pricing has been the most utilised method in every single bulletin to date. Twenty-six QDCs/QSCs have utilised the new alternative pricing methods to date. The most common alternative pricing method used so far is Commercial pricing.
Figure 11: Number of QDCs/QSCs that use each pricing method in a proportion of the contract
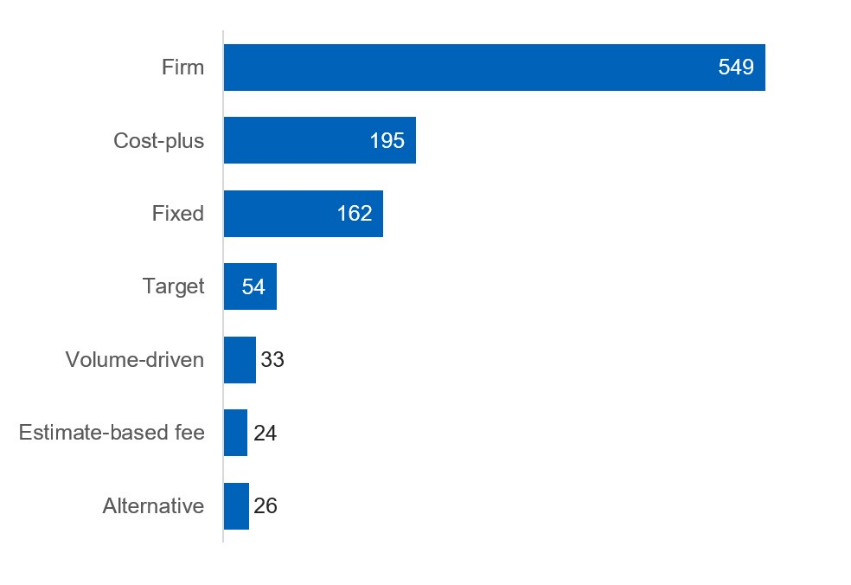
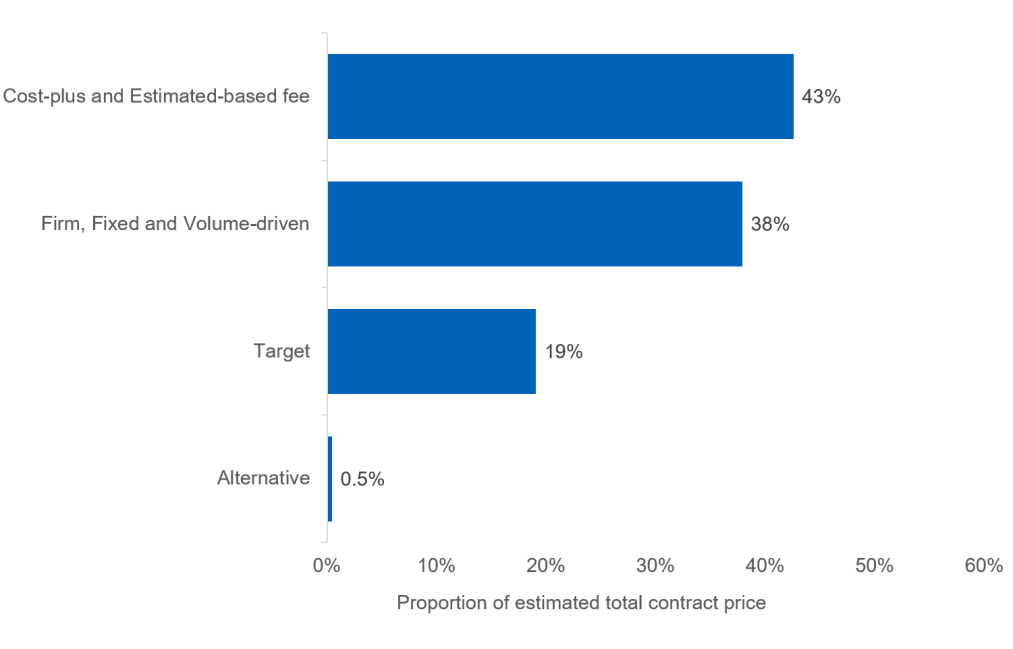
Figure 12 presents the proportion of the estimated contract price attributed to each of the pricing methods across the 788 QDCs/QSCs that provided this data. Some pricing methods have been grouped due to the similar ways in which profit risk sharing is treated in these. Cost-plus and estimate-based fee pricing methods have the highest proportion of the total contract price associated with them, at 43 per cent, closely followed by firm, fixed and volume driven pricing at 38 per cent. The alternative pricing methods have a combined contract price of 0.5 per cent of the total contract price. Variation in the contract price associated with different pricing methods can be influenced by a small number of high value contracts.
Figure 12: Proportion of estimated total contract price split by pricing method
Sub-contracts
The data presented in this subsection includes the latest estimated total price of all sub-contracting within QDCs/QSCs. In the ‘Number, duration and SME involvement’ section of the bulletin, only the number of sub-contracts with a value of £1 million or more are reported, not all sub-contracts. The total price presented here is therefore not consistent with the number of sub-contracts reported in the previous section. QSCs are included in this analysis as they are sub-contracts to QDCs. All data is sourced from the latest report containing information on sub-contracts for the whole contract, and the statistics do not necessarily represent the sub-contract prices once the contract is complete.
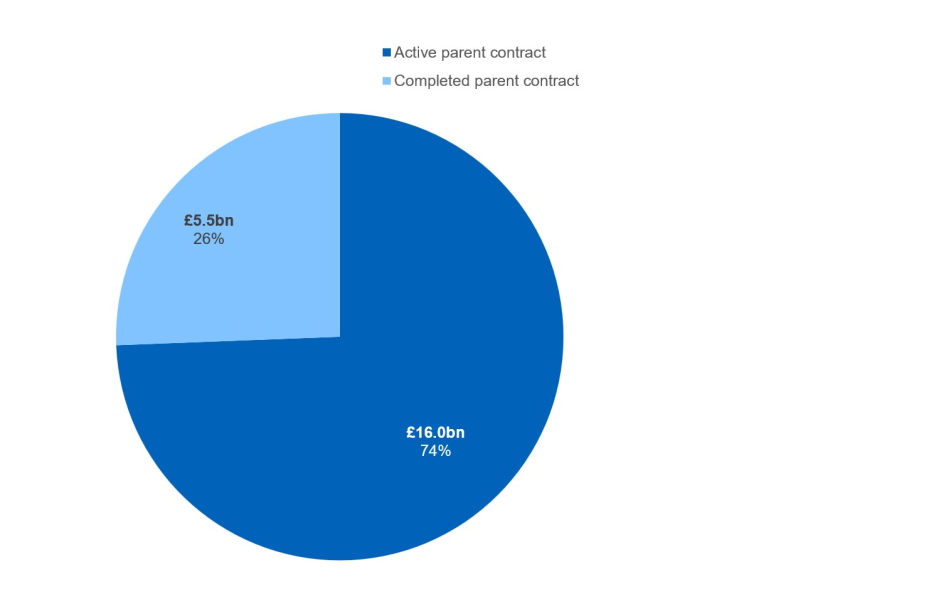
Figure 13 below shows the latest total estimated price of sub-contracts to QDCs/QSCs, by contract status. In total, there was £21.5 billion of sub-contracting within QDCs/QSCs, and 76 percent of the latest total estimated price of sub-contracts to QDCs/QSCs is attributable to active (rather than completed) parent QDC/QSCs.
Figure 13: Total estimated sub-contract price, by contract status
Please note that some of the individual sub-contracts reported may contribute to more than one parent contract, so the sub-contract prices reported are not necessarily fully attributable to the QDC/QSC it has been reported against. Some of the sub-contract prices used in these figures may therefore overestimate the amount of sub-contracting occurring within the QDC/QSC it has been reported against.
Components
As of 30 April 2026, the SSRO had been notified of 646 components of which 537 had submitted a report. Table 7 shows these 537 components by component price band. The majority (60 per cent) of components have a price of £10 million or less.
Table 7: Number of components by component price band
| Component Price band | Number of components | Percentage (%) |
| Less than or equal to £10m | 321 | 60 |
| Greater than £10m to £20m | 44 | 8 |
| Greater than £20m to £30m | 26 | 5 |
| Greater than £30m to £40m | 14 | 3 |
| Greater than £40m to £50m | 15 | 3 |
| Greater than £50m to £100m | 34 | 6 |
| Greater than £100m to £500m | 64 | 12 |
| Greater than £500m | 19 | 4 |
| Total | 537 | 100 |
Profit
Estimated contract profit rates, including the adjustments made to the baseline profit rate.
Summary
- For contracts that became QDCs/QSCs in 2025/26, the average (mean) contract profit rate at the latest time of agreement was 10.75 per cent, an increase of 0.87 percentage points compared to an average of 9.89 per cent in 2024/25 QDCs/QSCs.
- Aside from the baseline profit rate, the adjustment with the highest average impact on the contract profit rate was the capital servicing adjustment in all financial years. The average (mean) capital servicing adjustment was 1.45 per cent in 2025/26 QDCs/QSCs.
Of the 750 QDCs/QSCs across all financial years that submitted profit rate step information, 143 (19 per cent) had reported an incentive adjustment.
The Defence Reform Act 2014 and the Single Source Contract Regulations 2014 (as amended) together prescribe a four-step process to determine the contract profit rate for a QDC/QSC. Before 1 April 2024, the legislation provided for two additional profit rate steps; the Profit On Cost Once (POCO) adjustment and the SSRO Funding Adjustment. These two steps are still shown in the databook for comparability to historic data but will show as zero or not applicable for all QDCs/QSCs from 2024/25 onwards. For more information on the profit rate and these steps, please refer to the SSRO’s Guidance on the baseline profit rate and its adjustment.
Additionally, the amendments to the Regulations in 2024 introduced changes to how profit data is submitted if a contract includes components (a component of a contract means a part of a contract that is to be treated distinctly from other such parts in determining the price payable under a contract). Contractors may need to provide the profit rate step information at a component level, rather than at the overall contract level. The SSRO announced in a previous bulletin that we would start to incorporate this component level information when reporting the profit rate step statistics in this section, subject to a data quality review. On a review of the component level profit rate step data this year, it was found that there is some further investigation to complete around the use of the data and it has been decided to continue to exclude from the analysis. The SSRO will continue to monitor and review this data and will include it in the statistics when appropriate.
The data presented in this section is based on estimated profit rates at the latest time of agreement (either the date the contract became a QDC/QSC, or the date of the latest pricing amendment if an on-demand Contract Pricing Statement (CPS) has been submitted) and does not necessarily represent the profit that will be achieved once the contract is complete. The estimated profit rate data may differ from the profit information reported in the ‘Price and pricing methods’ section, which can be sourced from more up-to-date reports that contain the overall profit rate, but not the detail of the profit rate steps. The ‘Outturn price of completed contracts’ section includes information on the actual and forecast profit in completed contracts.
There are 20 QDCs/QSCs that either did not provide any profit rate information, provided information with data quality concerns, or used the Government Owned Contractor Rate (GOCR), and so have been excluded from all analysis in this section.
Table 8 shows the average (mean) overall contract profit rates for the 778 QDCs/QSCs that were included in the analysis. The average contract profit rate for 2025/26 QDCs/QSCs is 10.75 per cent, an increase from 2024/25 QDCs/QSCs at 9.89 per cent of 0.86 percentage points. During the same period the baseline profit rate set by the Secretary of State increased by 0.32 percentage points to 8.56 per cent. Whilst the baseline profit rate is a fixed rate set by the Secretary of State each year, some QDCs/QSCs had reported a different rate to this, sometimes as the result of reporting an average of two or more rates.
Table 8: Average (mean) contract profit rate agreed at the latest time of agreement, by financial year
| Financial year in which contract became a QDC/QSC | Average contract profit rate (%) |
| 2015/16 | 10.85 |
| 2016/17 | 10.56 |
| 2017/18 | 8.45 |
| 2018/19 | 8.40 |
| 2019/20 | 9.03 |
| 2020/21 | 9.55 |
| 2021/22 | 9.55 |
| 2022/23 | 9.48 |
| 2023/24 | 9.90 |
| 2024/25 | 9.89 |
| 2025/26 | 10.75 |
| Total | 9.63 |
The following analysis in this section is based on 750 QDCs/QSCs as a further 28 QDCs/QSCs did not provide profit rate step data in the standard fields of their latest submitted report and so have been excluded from the analysis on the profit steps. Please see the methodology for an explanation of reasons for this. Figures 14 and 15 below show the average (mean) adjustments made to the baseline profit rate (BPR) for each profit rate step, for the contracts that became QDCs/QSCs in 2024/25 and 2025/26 respectively. The overall average (mean) contract profit rates differ from those shown in Table 8 due to the excluded contracts described above.
For those contracts that supplied profit rate step data, the largest change in the profit rate steps (between 2024/25 and 2025/26) was the average cost risk adjustment, which increased by 0.48 percentage points (from -0.04 percentage points in 2024/25 to 0.44 percentage points in 2025/26). The average capital servicing adjustment remains as the largest adjustment to the Baseline Profit Rate, at 1.45 percentage points in 2025/26.
Figure 14: Average (mean) profit rate steps agreed at the latest time of agreement, for 2024/25 QDCs/QSCs
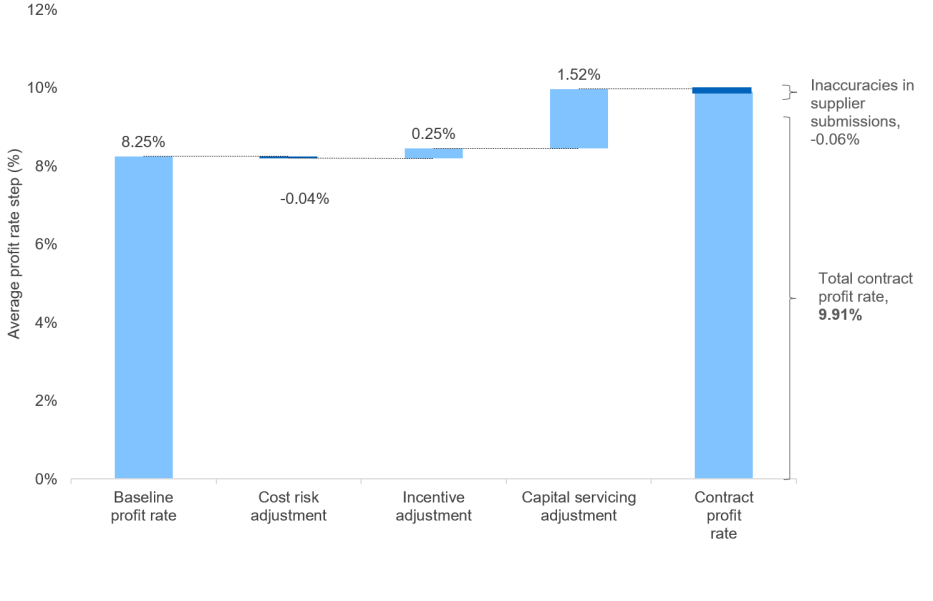
Figure 15: Average (mean) profit rate steps agreed at the latest time of agreement, for 2025/26 QDCs/QSCs[1]
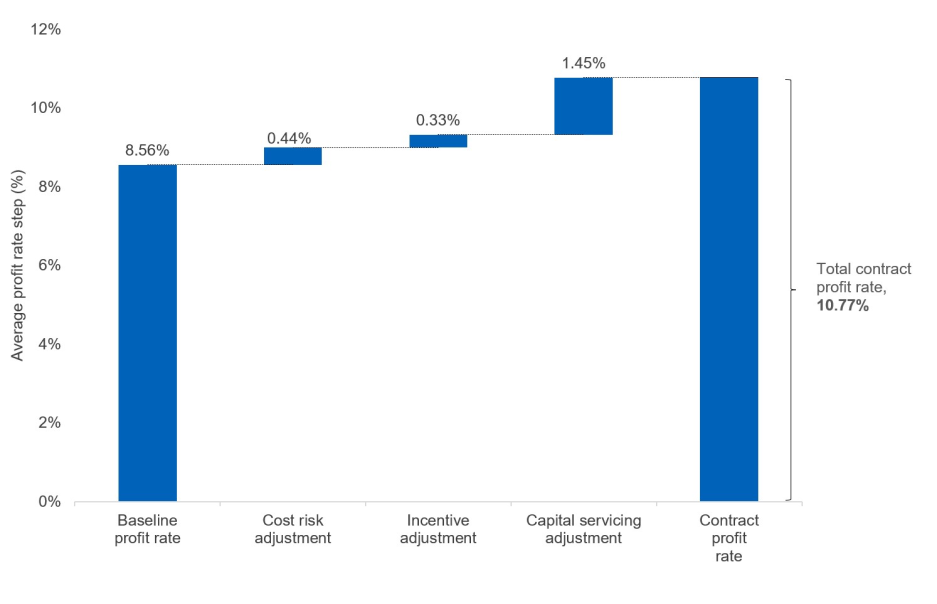
[1] Note: Some QDCs/QSCs had reported a BPR that differed from the rate set by the Secretary of State for that year (for example where a profit rate includes sunk costs, before the BPR was set, or where an amendment to a contract uses a BPR from a different year), which explains why these figures do not show the published rates.
The most significant factor in determining a QDC’s/QSC’s contract profit rate, on average, across all years was the baseline profit rate, comprising on average 79 per cent of the contract profit rate in 2025/26 (see Table 9). The second most impactful adjustment was the capital servicing adjustment, which comprised 13 per cent of the contract profit rate in 2025/26 QDCs/QSCs, a slightly lower proportion to the previous year.
Table 9: The contribution of each profit rate step towards the average contract profit rate, by financial year in which the contract became a QDC/QSC[1]
| Profit Rate Step (%) | 2021/22 | 2022/23 | 2023/24 | 2024/25 | 2025/26 |
| Baseline profit rate | 86% | 87% | 83% | 83% | 79% |
| Cost-risk adjustment | 3% | 5% | 5% | 0% | 4% |
| Profit-on-cost-once adjustment | -2% | -5% | -2% | N/A | N/A |
| SSRO funding adjustment | -1% | 0% | 0% | N/A | N/A |
| Incentive adjustment | 4% | 3% | 4% | 2% | 3% |
| Capital servicing adjustment | 10% | 12% | 12% | 15% | 13% |
| Other (reporting issues) | 0% | -1% | -1% | -1% | 0% |
| Contract profit rate | 100% | 100% | 100% | 100% | 100% |
[1] The ‘inconsistencies in supplier data’ row relates mostly to data quality issues, where the reported profit rate steps do not sum to the total contract profit rate reported by contractors.
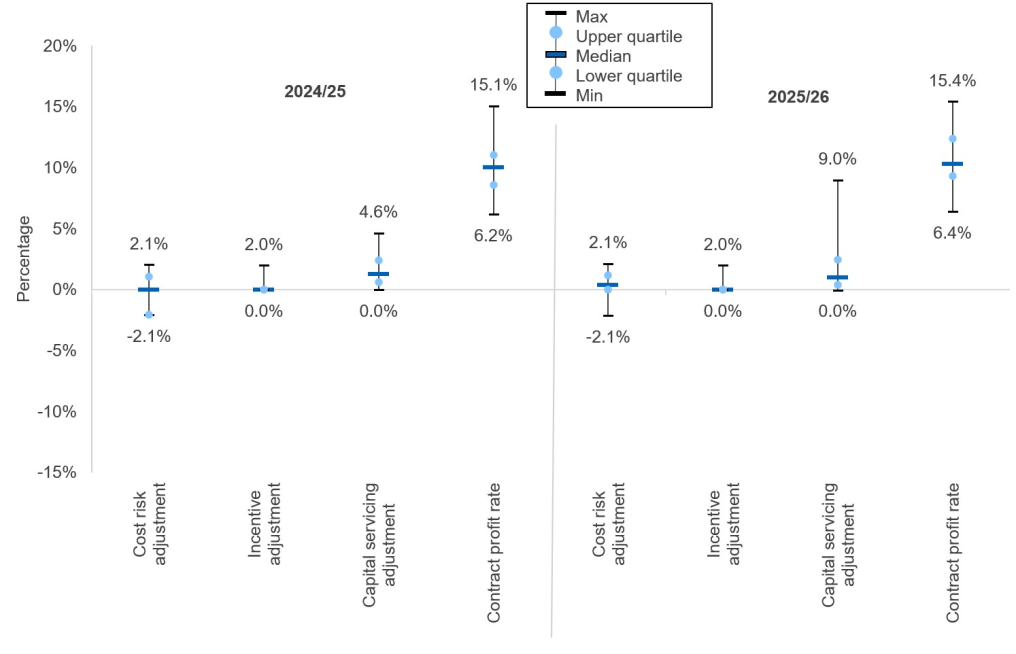
Figure 16 below shows the maximum, minimum, median and interquartile values reported for each of the profit rate adjustments (excluding the baseline profit rate and SSRO funding adjustment, which are fixed values), and the contract profit rate, for 2024/25 and 2025/26 QDCs/QSCs.
Some of the maximum and minimum points may be considered outliers, and so the interquartile range has been included to provide more information on the distribution of data points for each step, specifically the spread of values within the central 50 per cent of the data. The interquartile range of most profit steps has remained relatively consistent between 2024/25 and 2025/26 QDCs/QSCs.
The contract profit rate of QDCs/QSCs in 2025/26 ranged from 6.4% to 15.4%. As previously mentioned, from 1 April 2024 the POCO adjustment no longer applies, but data for previous financial years is shown in the accompanying databook.
Figure 16: Maximum, minimum, median and interquartile range of profit rate steps reported in individual QDCs/QSCs, for 2024/25 and 2025/26 QDCs/QSCs
Not all contracts receive an adjustment for each of the profit rate steps. Most contracts did not report an incentive adjustment. Table 10 below shows the number of QDCs/QSCs that reported an incentive adjustment. Of the 750 QDCs/QSCs that were included in the analysis across all financial years, 143 (19 per cent) had reported an incentive adjustment.
Table 10: Number of QDCs/QSCs that have reported incentive adjustments, by financial year in which the contract became a QDC/QSC
| Financial year in which contract became a QDC/QSC | Total number of QDCs/QSCs | Number of QDCs/QSCs with a non-zero incentive adjustment | |
| Number | % | ||
| 2015/16 | 30 | [c] | [c] |
| 2016/17 | 59 | [c] | [c] |
| 2017/18 | 50 | 8 | 16 |
| 2018/19 | 59 | 13 | 22 |
| 2019/20 | 86 | 17 | 20 |
| 2020/21 | 68 | 16 | 24 |
| 2021/22 | 92 | 19 | 21 |
| 2022/23 | 85 | [c] | [c] |
| 2023/24 | 73 | [c] | [c] |
| 2024/25 | 80 | [c] | [c] |
| 2025/26 | 68 | 12 | 18 |
| Total | 750 | 143 | 19 |
As mentioned, the data presented in this section is based on estimated profit rates at the time of agreement and does not necessarily represent the profit that will be achieved once the contract is complete. The actual profit rate achieved will depend on the performance of the contract, the pricing methods used, and any final price adjustments agreed.
The use of different pricing methods is one of the factors which can expose the contracting parties to varying amounts of financial risk that the actual costs of a contract differ from the estimated costs. The purpose of the cost risk adjustment is to incorporate into the contract profit rate an addition or deduction to reflect the financial risks to the contractor of entering into the contract or component, taking into account the particular type of activities to be carried out by the primary contractor under that contract or component. This adjustment can be between +/- 25 per cent of the baseline profit rate. Further information on this adjustment can be found in the SSRO’s Guidance on the baseline profit rate and its adjustment.
Figure 17 below shows the maximum, median, minimum and interquartile range of cost risk adjustments (as a percentage of the BPR) agreed within contracts using at least one of the pricing methods. Contracts can employ multiple pricing methods, and so QDCs/QSCs have been allocated to a ‘primary’ pricing method if more than 75 per cent of the contract price is reported against that pricing method. Where there is no one pricing method with more than 75 per cent of the contract price, this is classified as ‘mixed’. Some pricing methods have been grouped due to the similar ways in which profit risk sharing is treated in these. Contracts that use Alternative pricing have been excluded from this statistic due to low numbers of contracts. In addition to the contracts that have not provided sufficient profit rate data, an additional number of contracts have not reported pricing method data. Therefore, the analysis below is based on 735 contracts.
Figure 17: Maximum, median, minimum and interquartile range of estimated Cost Risk Adjustment as a percentage of Baseline Profit Rate, by primary pricing method, for all QDCs/QSCs
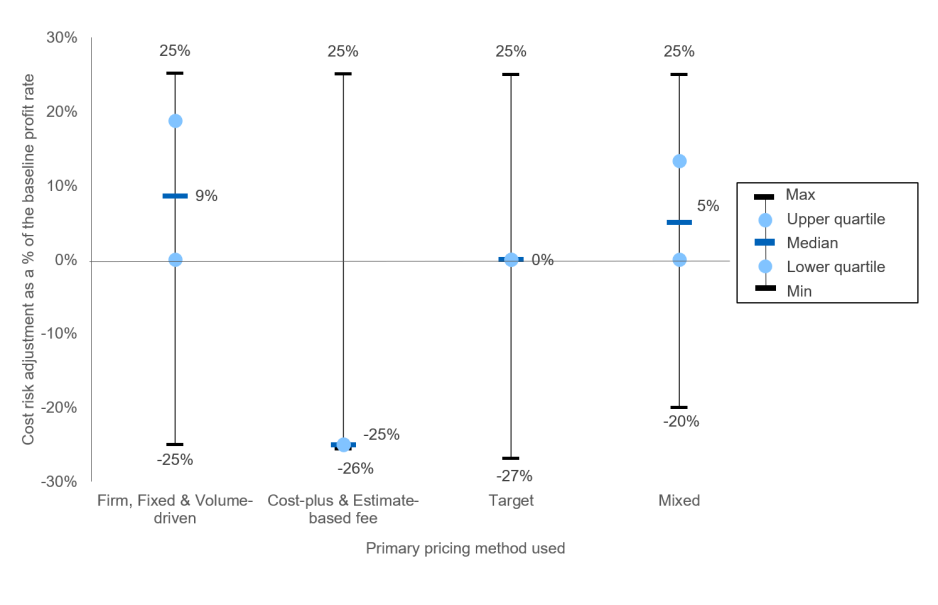
The SSRO’s Guidance on the baseline profit rate and its adjustment states that for cost-plus and estimate-based fee contracts the cost risk adjustment should be set at minus 25 per cent of the baseline profit rate, which is why the median and interquartile range for these pricing methods appears much lower compared to other pricing methods.
Other pricing methods have more variation in the cost risk adjustment applied across contracts, with some pricing methods using the full range of +/-25 per cent of the baseline profit rate. The median for firm, fixed and volume-driven contracts is higher than for other pricing methods at +9 per cent of the baseline profit rate (though mixed has a similar median and interquartile range, which will include a large proportion of firm, fixed and volume-driven contracts).
Firm, fixed and volume-driven contracts also have the widest interquartile range; the central 50 per cent of these contracts covers the greatest range of cost risk adjustment values (as a percentage of the BPR) from 0 to +19 per cent. The interquartile range for target pricing contracts is zero. Some contracts have reported cost risk adjustments that fall outside of the +/- 25 per cent threshold, and the statistics use this data as reported by contractors.
Outturn price of completed contracts
Actual and forecast costs, profit, price and profit rates, for contracts that have submitted contract completion reports.
Summary
- As of 30 April 2026, a third of all QDCs/QSCs (260 out of 798) have submitted contract completion reports, indicating they have completed.
- Completed contracts have a total estimated contract price (at the latest time of agreement) of £18.6 billion, representing 13 per cent of the total estimated contract price for all QDCs/QSCs (based on 248 contracts with sufficient price data).
- These contracts reported an actual and forecast price at contract completion of £17.6 billion; a reduction of £1.0 billion compared to the estimated contract price at the latest time of agreement. This consisted of a reduction in Allowable Costs of £1.08 billion, and an increase in profit of £68 million.
- Around 40 per cent of completed QDCs/QSCs (104 contracts) reported no change in the actual and forecast contract price compared to the estimates at the latest time of agreement. Around 40 per cent (96 contracts) reported a reduction, and around 20% (48 contracts) reported an increase in contract price.
This section reports on the contractors’ assessment of the outturn price of contracts payable by the contracting authority, at the date the Contract Completion Report (CCR) is submitted. A contractor can still report some forecast costs (up to 5 per cent of the price without an explanation, or more if an explanation is given) when submitting a CCR, so the actual and forecast price may not reflect the final outturn price. It also does not reflect any final price adjustments or target cost incentive fee (TCIF) adjustments. For the purpose of this analysis, variances have been calculated between the estimated price at the latest time of agreement (either the date the contract became a QDC/QSC, or if there has been an amendment, the date of the latest amendment) and the actual and forecast price at the contract completion date. The variances therefore do not reflect changes due to previous amendments during the life of the contract, and must not be interpreted as an indicator of the overall change in cost, price or profit over the contract period since the contract was first entered into.
For the purpose of these statistics, a completed contract is defined as a contract with a submitted CCR. This is due six months after the contract completion date, so these statistics may not include contracts that have completed within six months of the report submission deadline for this bulletin (30 April 2026). If the CCR report has not been submitted, then the contract is defined as ‘active’ within these statistics. Please refer to the Methodology section for further details on how completed contracts are defined.
Contractors submitted 260 CCRs for QDCs/QSCs as of 30 April 2026. The statistics in this section analyse 248 contracts within these which provided sufficient information to report on variances in the total contract price. Findings relate only to this group of completed contracts and are not necessarily representative of the whole population of 798 QDCs/QSCs.
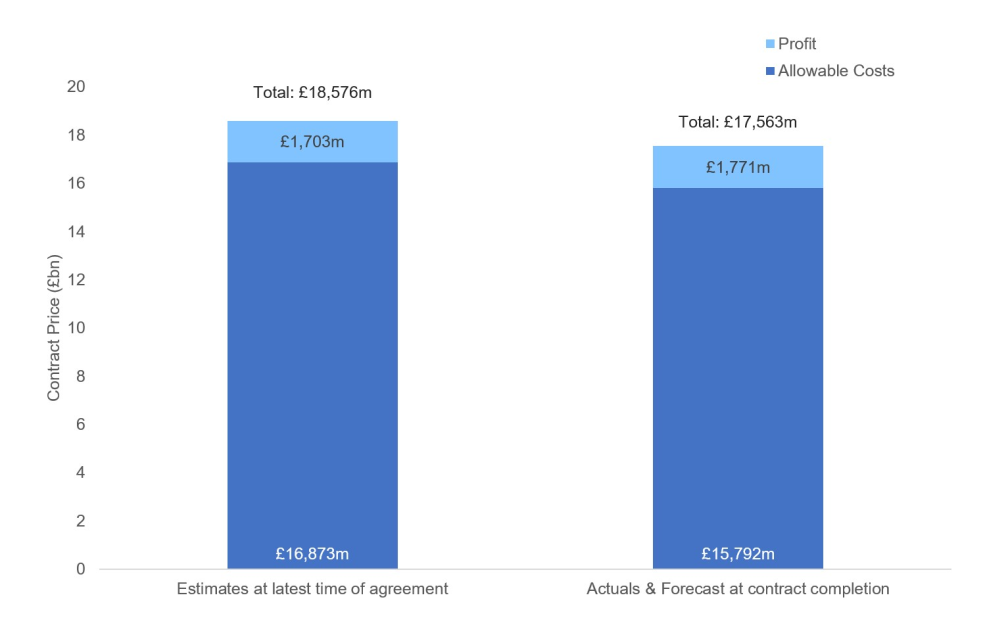
The 248 completed contracts had a total estimated contract price at the latest time of agreement of £18.6 billion, representing 13 per cent of the total estimated contract price for all QDCs/QSCs. The total contract price variance for completed contracts is shown in Figure 18. Completed contracts reported an actual and forecast contract price of £17.6 billion at contract completion; a reduction from the estimated price at the latest time of agreement of £1.0 billion (5 per cent). This is comprised of an overall reduction in Allowable Costs of £1.08 billion and an increase in profit of £68 million.
Following discussions with stakeholders, the SSRO agreed it would be useful to explore presenting the total estimated costs at the date the contract became a QDC/QSC alongside this statistic. However, an initial review of the data found that a data cleansing exercise will need to take place before this data can be incorporated. The SSRO will continue to investigate the quality of this data, with a view to including in future bulletins.
Figure 18: Overall estimated cost and profit at the latest time of agreement, and actual and forecast cost and profit at contract completion in 248 completed contracts
Figures 19 to 22 show the number of completed contracts reporting a variance between the estimates at the latest time of agreement and the actuals and forecasts at contract completion, by bands for the amount of variance for: Allowable Costs, profit, profit rate and contract price. The use of different pricing methods will have an impact on how the variation in costs affect the profits and prices of these contracts. For example, a firm price contract may report variances in its costs and profits, but no variance in the contract price. Three contracts did not provide enough information to calculate Allowable Cost variances, and twelve contracts did not provide sufficient information to calculate profit variances, so these have been excluded from the respective analysis on Allowable Costs, profit and profit rates (Figures 19 to 22). In total, twelve contracts have been excluded from the total contract price variance analysis (Figure 22).
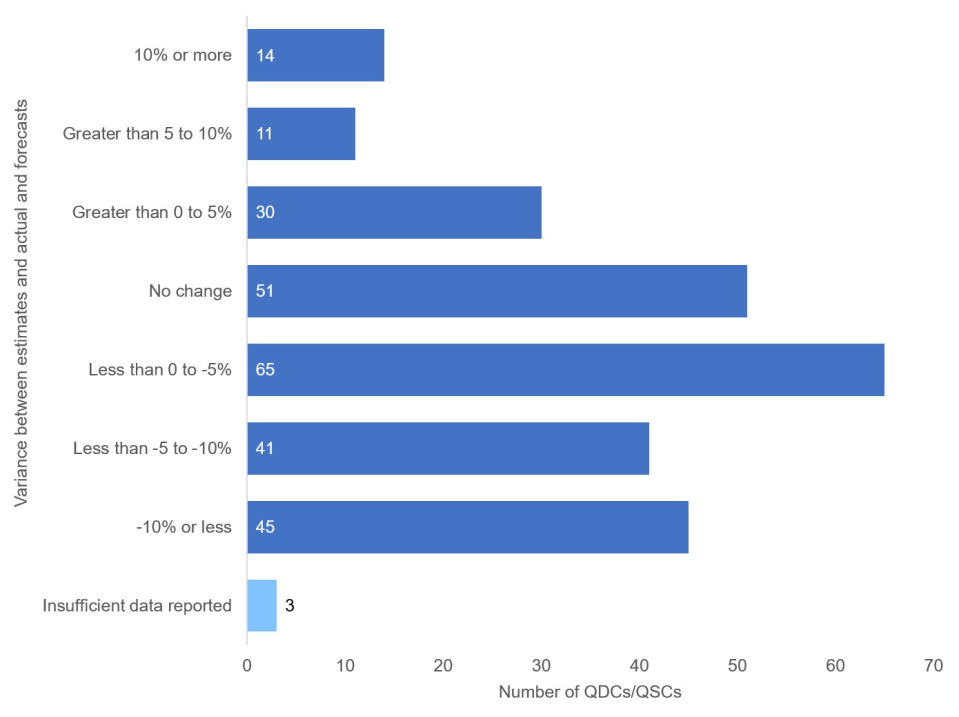
The majority (151 contracts, 59 per cent) of the 257 completed QDCs/QSCs that provided Allowable Cost data reported a reduction in Allowable Costs since the latest time of agreement, with 55 (21 per cent) reporting an increase in Allowable Costs (see Figure 19). The remaining 20 per cent reported no change in Allowable Costs.
Figure 19: Variance in Allowable Costs; number of completed QDCs/QSCs (260 contracts) by percentage of variance between the estimated Allowable Costs at the latest time of agreement and actual and forecast Allowable Costs at contract completion
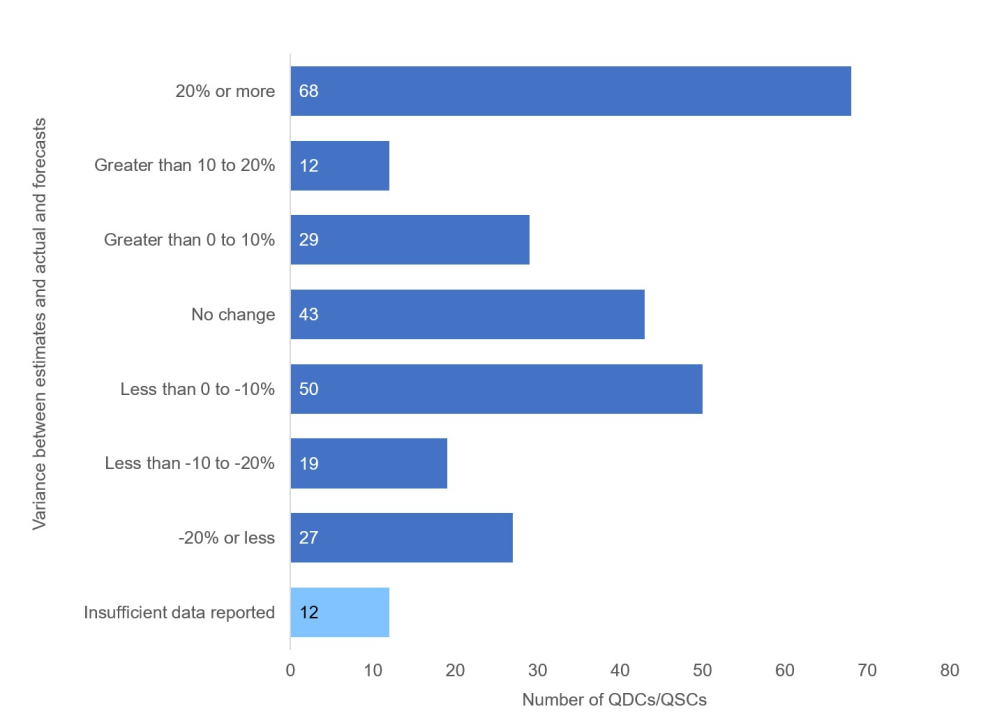
Since profits are a smaller component of the contract price than Allowable Costs, small changes in the amount of Allowable Costs can result in larger percentage variances in the amount of profit, as can be seen in Figure 20. Around 40 per cent of completed contracts (96 of the 248 QDCs/QSCs that provided profit data) reported a reduction in profit since the latest time of agreement, and around 40 per cent (109 contracts) reported an increase in profit. Just over a quarter of completed contracts (68 QDCs/QSCs, 27 per cent) reported an increase in profit of more than 20 per cent, and around 10 per cent (27 QDCs/QSCs, 11 per cent) reported a decrease in the amount of profit of more than 20 per cent.
Figure 20: Variance in amount of profit; number of completed QDCs/QSCs (260 contracts) by percentage of variance between the estimated profit at the latest time of agreement and actual and forecast profit amount (£m) at contract completion
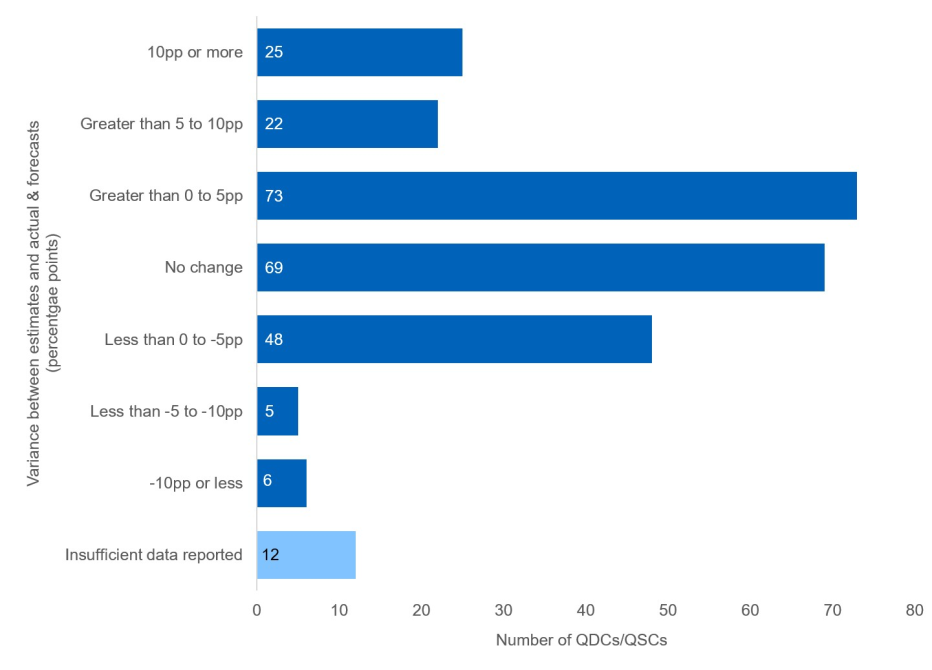
Whilst Figure 20 looks at the variance in the amount of profit, Figure 21 analyses the variance in the profit rate percentages of the completed contracts. The majority of contracts (77 per cent of the 248 QDCs/QSCs that reported profit rate data) reported a variance in profit rates of between -5 and +5 percentage points. Almost 30 per cent reported no change in the profit rate (69 contacts; 28 per cent). There were 25 contracts (10 per cent) that reported an increase in their actual and forecast profit rates of more than 10 percentage points, and 6 contracts (2 per cent) reported a decrease in profit rates.
Figure 21: Variance in profit rates; number of completed QDCs/QSCs (260 contracts) by percentage points of variance between the estimated profit rate at the latest time of agreement and actual and forecast profit rate at contract completion
When looking at the overall contract price, as shown in Figure 22, 39 per cent of the 248 QDCs/QSCs that reported price data (96 QDCs/QSCs) reported a decrease in contract price compared to the latest time of agreement, and similarly 42 per cent (104 contracts) experienced no change in price. The pricing methods used in a contract will affect the interaction between variances in Allowable Costs, profit and the total contract price. For example, a firm priced contract may report variances in the Allowable Costs and/or profit, but no change to its total contract price. Around 20 per cent (48 contracts) reported an increase in contract price since the latest time of agreement.
Figure 22: Variance in contract price; number of completed QDCs/QSCs (260 contracts) by percentage of variance between the estimated contract price at the latest time of agreement and actual and forecast contract price at contract completion
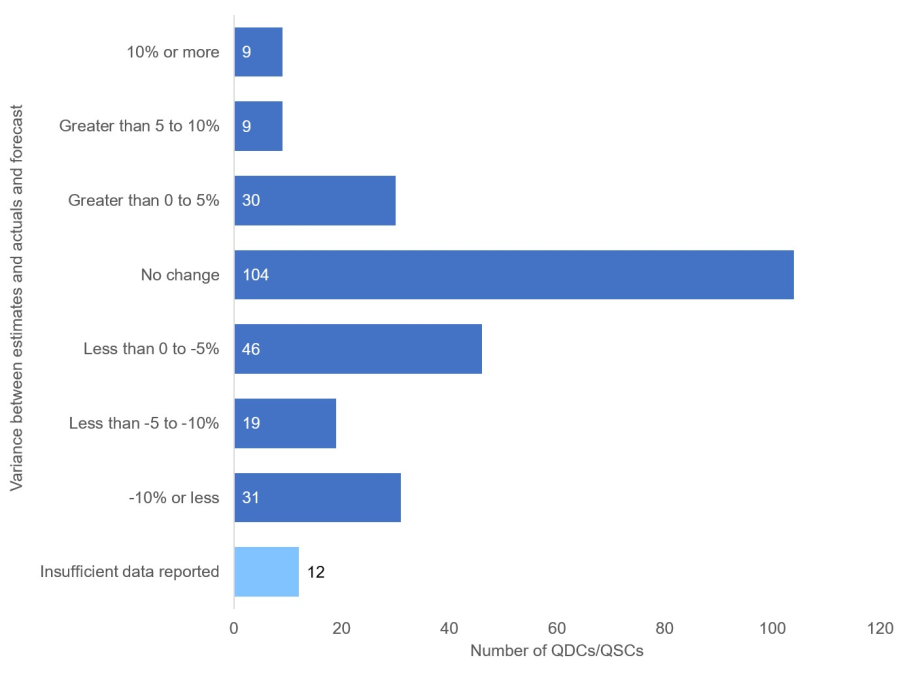
Table 11 shows both the mean and median contract profit rates estimated at the latest time of agreement and the actual and forecast profit at contract completion, split out by pricing method (for 246 QDCs/QSCs that provided sufficient profit rate and pricing method information). Contracts with alternative pricing as the primary pricing method have been excluded from the analysis, due to low numbers of completed contracts using these pricing methods. Following discussions with stakeholders, the SSRO agreed it would be useful to explore presenting the total estimated costs at the date the contract became a QDC/QSC alongside this statistic. However, an initial review of the data found that a data cleansing exercise will need to take place before this data can be incorporated. The SSRO will continue to investigate the quality of this data, with a view to including in future bulletins.
Table 11: Average contract profit rates at the latest time of agreement and actual and forecast at contract completion for 246 completed QDCS/QSCs
| Primary Pricing Method | Mean contract profit rate (%) | Median contract profit rate (%) | ||
| Estimate at latest time of agreement | Actual and forecast in contract completion report | Estimate at latest time of agreement | Actual and forecast in contract completion report | |
| Firm, Fixed & Volume-driven | 9.81 | 12.33 | 9.76 | 10.59 |
| Cost-plus & Estimate-based fee | 7.60 | 7.68 | 7.44 | 7.42 |
| Target | 10.87 | 12.60 | 8.55 | 8.49 |
| Mixed | 13.86 | 16.63 | 9.68 | 9.71 |
| Overall | 9.71 | 11.77 | 9.46 | 9.63 |
The overall mean and median estimated profit rates were 9.71 per cent and 9.46 per cent respectively. When looking at the actual and forecast average profit rates, the mean profit rate increased to 11.77 per cent and the median profit rate increased to 9.63 per cent. These averages are for the 246 contracts that have provided sufficient information, and these may not be representative of the outturn at completion of all 798 contracts. A small number of contracts reported particularly high actual profit rates, resulting in a mean actual and forecast contract profit rate higher than the median.
When looking at the data by primary pricing method, mixed pricing method contracts report the largest variance between estimates and actual and forecast mean profit rates (13.86 per cent estimated and 16.63 per cent actual and forecast). This is a similar amount of variance to firm, fixed and volume-driven priced contracts (9.81 per cent estimated, and 12.33 per cent actual and forecast). Both the mean and median actual and forecast profit rates are higher than estimates for firm, fixed, volume-driven, and mixed primary pricing methods. On the other hand, for cost-plus and estimate-based fee, and target pricing, the median actual and forecast profit rate is lower than the estimate.
Compliance with reporting requirements
Summary
- The number of reports due for submission in 2025/26 increased by 6 per cent from 2024/25.
- The overall timeliness for contract and supplier reports, at 66 per cent, has decreased slightly since last year and remains below the SSRO’s Key Performance Indicator (KPI) target of 75 per cent.
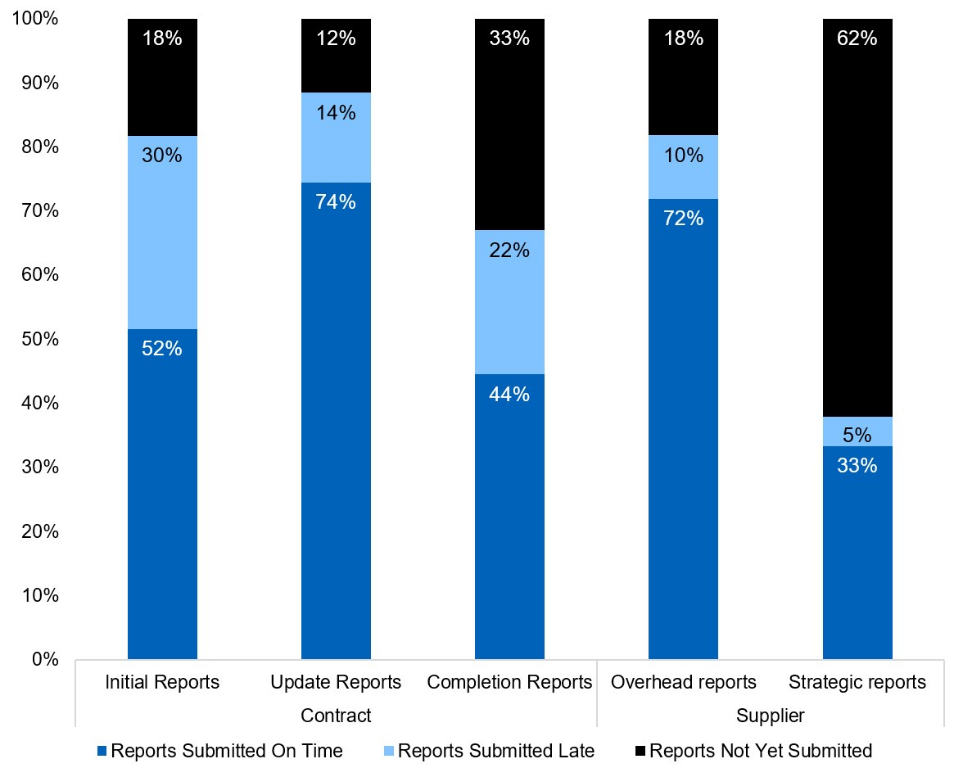
- Completion reports saw the greatest year-on-year decline in on-time submissions, decreasing from 72 per cent in 2024/25 to 44 per cent in 2025/26. Other report groups did not deviate by more than 3 per cent.
- 3 per cent of submissions contained active compliance issues as of 31 May 2026, surpassing the KPI target of 5 per cent (consisting of 3 per cent of contract reports and 1 per cent of supplier reports).
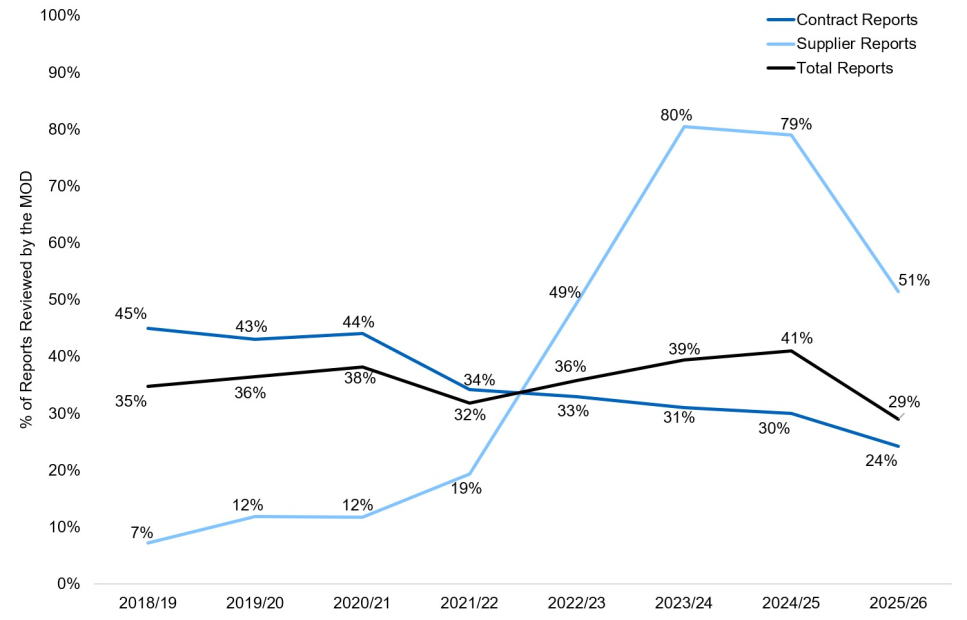
- The SSRO reviewed 83 per cent of report submissions. The MOD reviewed 29 per cent of report submissions (24 per cent of contract reports and 51 per cent of supplier reports).
The MOD notified the SSRO of 94 Compliance Notices. This was an increase from the 88 compliance notices which were issued last year. To date, the MOD has not notified the SSRO of any penalty notices issued under the Regulations.
The SSRO’s published compliance and review methodology (the methodology) sets out how it will keep under review the extent to which companies subject to reporting requirements are complying with them. Where referring to SSRO report ‘reviews’ in this bulletin, this relates to the processes set out in this methodology.
Historical data in this bulletin relates to the period commencing from 1 May 2018, when compliance related data first became available in DefCARS.
The Secretary of State may take enforcement action for non-compliance with the Regulations, which includes issuing compliance and penalty notices, while the SSRO can support contractors in complying with their reporting obligations and the MOD’s compliance activities. The SSRO seeks to improve compliance with the Single Source Contract Regulations 2014 (the “Regulations”) by:
- providing guidance on Regulations that may benefit from further interpretation;
- engaging regularly with industry through reporting workshops;
- providing contractors with a significant number of QDCs with monthly management information to assist in tracking required submissions;
- providing management information and analysis to the MOD to help prioritise areas for compliance activities; and
- acting as an independent investigator and arbitrator to settle disagreements between contractors and the MOD in respect of compliance and compliance related matters.
The SSRO continues to work with the MOD and industry so that the SSRO is best able to support compliance outcomes to help deliver value for money and fair and reasonable prices in defence procurement.
Report submission timeliness
Since May 2018, contractors have been required to submit a total of 10,682 reports based on requirements under the Regulations; contractors have submitted 89 per cent of these (9,527 reports). Table 12 details the number of reports required under the Regulations by report type each year. The SSRO expected 2,003 reports in 2025/26, an increase of 122 reports compared to 2024/25. Of these 2,003 reports, 82 per cent were submitted (1,649 reports).
Table 12: Total number of expected reports by financial year, by report type
| Financial Year | Initial Reports | Update Reports | Completion Reports | Overhead Reports | Strategic Reports | Total |
| 2023/24 | 261 | 903 | 121 | 237 | 62 | 1,584 |
| 2024/25 | 303 | 997 | 130 | 387 | 64 | 1,881 |
| 2025/26 | 279 | 1,107 | 227 | 324 | 66 | 2,003 |
The SSRO publishes a Key Performance Indicator (KPI) in its corporate plan, with a target that 75 per cent of contractors’ reports are submitted on time. In 2025/26, timeliness (the proportion of expected reports that are submitted on time) declined by 4 percentage points when compared to the previous year (66 per cent compared to 70 per cent in 2024/25). It has consistently remained below the SSRO’s KPI target of 75 per cent (see Figure 23). Figure 24 shows report timeliness for contract and supplier report submissions. While timeliness has ranged between 61 per cent and 71 per cent since 2018/19, there has been a 4 percentage point decrease in both contract and supplier reports in 2025/26.
Figure 23: Proportion of all expected reports submitted on time, by financial year
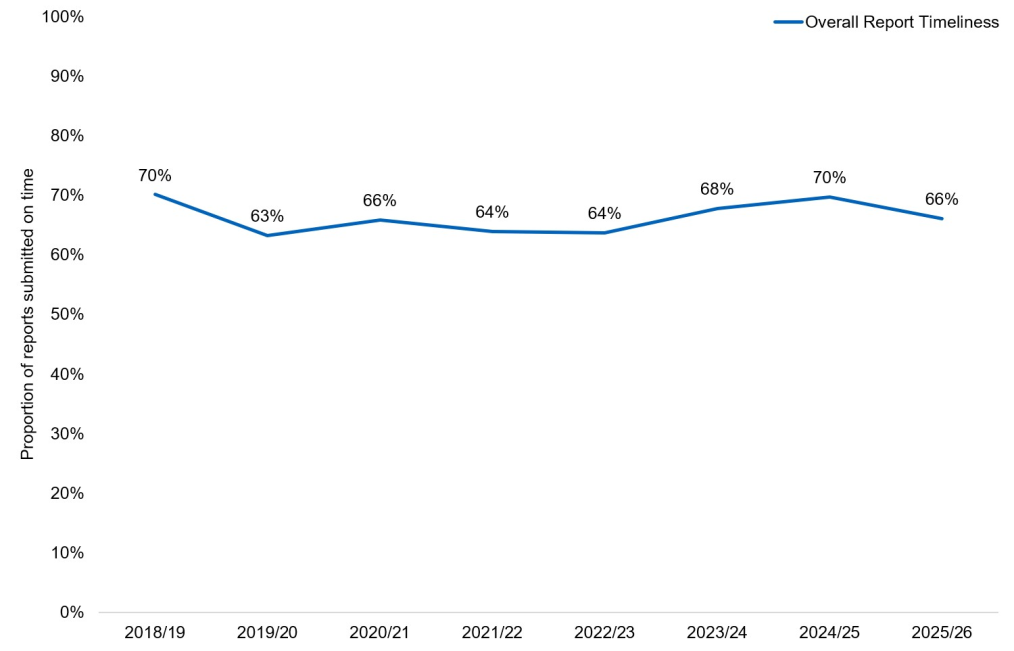
Figure 24: Proportion of expected reports submitted on time, for contract and supplier reports, by financial year
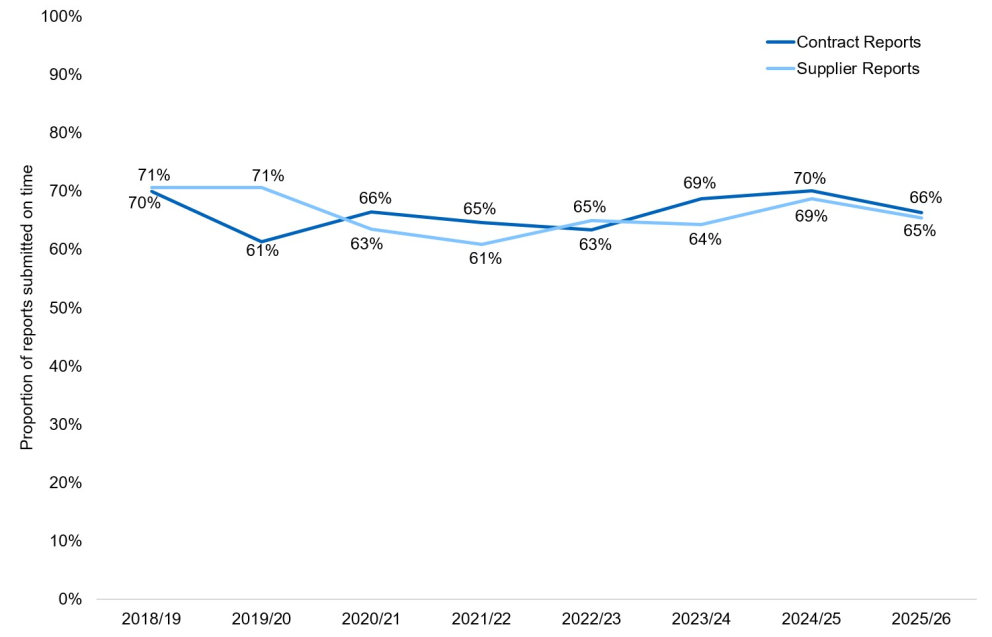
Figure 25 shows the timeliness of report submission by report type for 2025/26. In 2025/26, the proportions of reports submitted on time for most report groups remains similar to that in 2024/25, apart from completion reports which have seen a decrease in timeliness from 72% to 44%. Further detail on the timeliness in 2024/25 can be found in the accompanying databook.
Figure 25: Timeliness of expected reports, by report type and timeliness status in 2025/26
A total of 84 per cent of all the contract reports and 74 per cent of all the supplier reports expected during 2025/26 were submitted by 31 May 2026.
Report submission quality
The SSRO changed its quality KPI for 2025/26. Previously, the KPI target was that 75 per cent of reports should be correct first time. The KPI is now focused on the percentage of submitted reports with outstanding reporting issues at one month after the end of the Reporting Period. This KPI is summarised as ‘reports with active issues’, with a target set at less than five per cent. Within this KPI the SSRO has made the following adjustments to the issues data:
- excluded active issues where contractors have responded but the issue has not yet been closed;
- excluded active issues raised within the two weeks prior to the cut-off date; and
- included closed issues if the reason for closure was due to a lack of a response.
The KPI highlights whether contractors have taken steps to improve the quality of submissions, subsequent to any issues being identified. This presents an improved measure of contractor engagement with the reporting and compliance processes.
This year three per cent of submissions had active issues remaining, better than the KPI of less than five per cent. This consisted of three per cent of contract reports and one per cent of supplier reports with active issues (see Table 14). The number of reports before the applicable exclusions were made when calculating this KPI (as described above), can be found in the accompanying databook.
Table 13: Reports with active issues (KPI) by report type in 2025/26
| Report Type | Number of Reports | Proportion of Reports Submitted |
| Contract Reports | 43 | 3% |
| Supplier Reports | 2 | 1% |
| Total Reports | 45 | 3% |
To assess quality, the reports need to be reviewed within DefCARS. In 2025/26 the MOD reviewed 29 per cent of submitted reports (478 out of 1,649 reports). The SSRO reviewed 83 per cent of submitted reports (1,363 out of 1,649 reports). When looking at reports reviewed by either the SSRO or the MOD, the proportion of reports reviewed increases to 90 per cent (1,492 out of 1,649 reports). Figure 26 shows a time series of the proportion of reports reviewed from 2018/19 to 2025/26 by the MOD. Total report reviews by the MOD decreased from 41 per cent in 2024/25 to 29 per cent in 2025/26. Contract report reviews decreased from 30 per cent in 2024/25 to 24 per cent in 2025/26, whereas supplier reports decreased from 79 per cent in 2024/25 to 51 per cent in 2025/26. However, it should be noted that report review figures for previous years can increase over time as MOD subsequently carry out their reviews after the cut-off date for this bulletin.
Figure 26: Reports reviewed by the MOD of reports submitted from 2018/19 – 2025/26
Figures 27 and 28 show a combined quality summary for all reports that the SSRO expected to receive since 2021/22 to 2025/26. These reports have been grouped based on statuses that have a material impact on the quality of the submission:
- the report was not submitted;
- the report has issues raised by the MOD or SSRO that have yet to be resolved by the contractor (see note under Figure 27 and 28);
- the report has not been reviewed by the MOD (as only MOD has access to the actual contract, its review is necessary to fully verify the expected data has been provided); and
- the report has been reviewed, and any outstanding issues have been resolved (at which point the data is expected to be of reasonably good quality).
Figure 27 shows that, in each year, the majority of the contract reports were not reviewed by the MOD. In contrast, Figure 28 shows a greater proportion of supplier reports have been reviewed by the MOD (with no outstanding issues) for most years, in comparison to contract reports.
Figure 27: Contract report quality measures summary
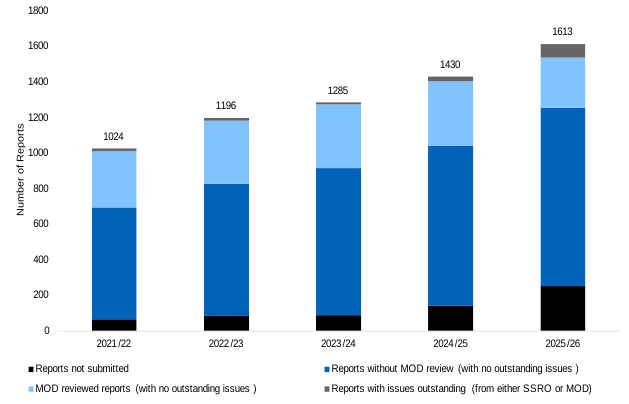
Note: Chart includes reports not submitted, and hence no quality assessment is possible for these. Reports with issues outstanding (from either SSRO or MOD) does not represent the new 2025/26 Quality KPI figure of active issues on reports, as it does not make all the adjustments set out earlier in this section.
Figure 28: Supplier report quality measures summary
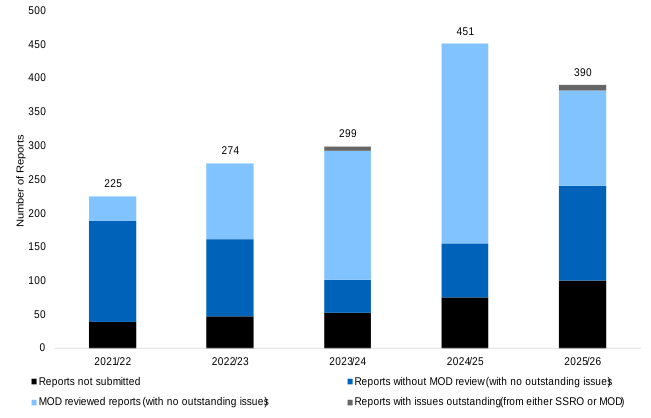
Note: Chart includes reports not submitted, and hence no quality assessment is possible for these. Reports with issues outstanding (from either SSRO or MOD) does not represent the new 2025/26 Quality KPI figure of active issues on reports, as it does not make all the adjustments set out earlier in this section.
There was a wide range of issues raised by the SSRO and the MOD on the statutory reports submitted in 2025/26. Figure 29 shows the top five themes identified from the issues raised by the MOD for both contract and supplier reports. Around half of issues raised by the MOD on contract reports (288 of 641 issues, 45 per cent) and 70 per cent of issues raised on supplier reports (387 of 553 issues) centred around these top five themes.
Figure 29: Top five themes from contract and supplier report issues raised by the MOD in 2025/26
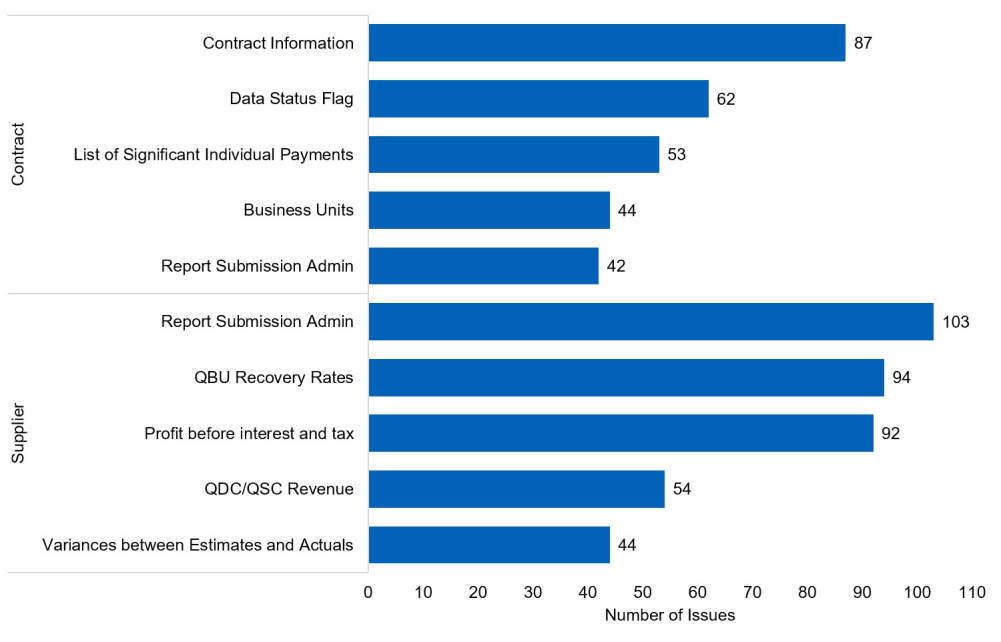
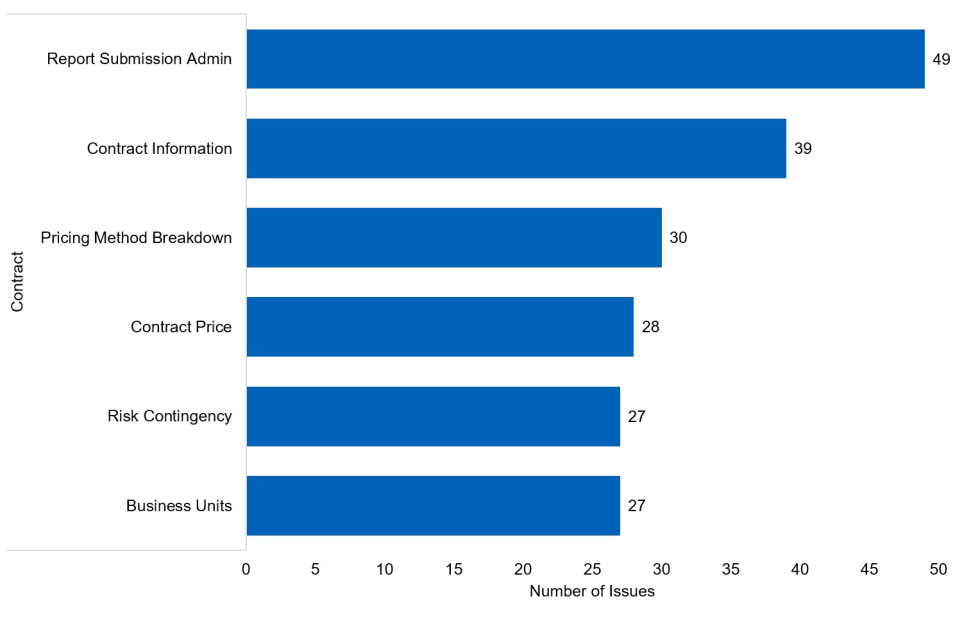
Figure 30 shows the top six themes identified from the issues raised by the SSRO for contract reports (six key themes are presented for contract reports as the fifth and sixth top themes had the same number of issues). Issue themes from supplier reports have not been included as the SSRO will not routinely conduct manual reviews of supplier reports. Around 40 per cent of the issues raised by the SSRO on contract reports (200 of 476 issues) related to these top six themes.
Figure 30: Top six themes from contract report issues raised by the SSRO in 2025/26
MOD enforcement action
The Secretary of State is empowered to take enforcement action for non-compliance with the Regulations if a contractor fails to meet its reporting obligations, which may, for example, be in relation to the examination of relevant records, a missing report submission or a submission that is in contravention of the reporting requirements as set out in the legislation. Enforcement may consist of the MOD issuing a Compliance Notice which requires a contractor to take action, or a Penalty Notice which imposes a fine.
The SSRO can support contractors in complying with their reporting obligations and the MOD’s compliance activities but is not permitted to issue Compliance Notices or Penalty Notices under the legislation.
Table 14 shows the MOD notified the SSRO of 94 Compliance Notices that were issued in 2025/26. The MOD did not notify the SSRO of any Penalty Notices in 2025/26. Further information on the breakdown of Compliance Notices and Penalty notices can be found in the accompanying databook.
Overall, in 2025/26, out of the 67 Compliance Notices attributable to contract reports, over half related to update reports (38 notices), 12 related to initial reports and 17 to completion reports. The majority of these notices (45 notices) resulted in missing or revised reports being submitted. Of these, 36 were submitted within the timeframe stipulated in the Compliance Notice, and 9 were submitted after the date set. As of 31 May 2026, for 17 Compliance Notices contract report submissions remained outstanding. The SSRO understands that 5 Compliance Notices were withdrawn as changes were made to the existing information on the system, usually a change to the contract reporting plan which provided an updated submission due date for the missing report.
The MOD issued 25 Compliance Notices attributable to supplier reports in 2025/26. Most of these Compliance Notices (23 notices) issued to suppliers resulted in missing or revised reports being submitted. Of these, 10 reports were submitted within the timeframe stipulated in the Compliance Notice, 13 were submitted after the date set and 2 submissions remained outstanding.
The MOD notified the SSRO of two Compliance Notices that were issued, subsequent to Examination Notices, for non-compliance with the duty to keep accounting and other records (Section 23 records). Following the issue of these Compliance Notices, information was provided within the timeframe stipulated in the Compliance Notice.
Table 14: Compliance Notices notified by the MOD to the SSRO in 2025/26
| Compliance Notice | Number of Compliance Notices | Report submitted within the timeframe* | Report submitted after the timeframe* | Notice withdrawn following update of existing information | Report submissions remain outstanding |
| Section 23 Records | 2 | 2 | 0 | 0 | 0 |
| Section 24 Contract reports | 67 | 36 | 9 | 5 | 17 |
| Section 25 Supplier reports | 25 | 10 | 13 | 0 | 2 |
*as stipulated in the Compliance Notice.
Notes to the statistics
Changes to the statistics
Following a feedback exercise with stakeholders, a number of changes were made to the 2025/26 bulletin. A number of additions and removals were made to statistics, as well as a new breakdown by contract status (active/completed) being added to many statistics. For the first time, statistics on contractor compliance with statutory reporting requirements are included in the bulletin. For more information on these changes, please see the announcement on the forthcoming changes to the 2025/26 annual statistics bulletin.
Data source
The data in this bulletin is sourced from contract and supplier reports submitted to the SSRO by contractors and collated in the Defence Contract Analysis and Reporting System (DefCARS). The individual reports used in each section of the bulletin are described in the methodology below. For further information about the data used, the SSRO’s reporting guidance for these reports is available on the SSRO’s website.
Methodology
Key contract statistics are presented for contracts which became QDCs/QSCs between 1 April 2015 and 31 March 2026, and that have submitted reports on or before 30 April 2026. Statistics on contractor compliance with statutory reporting requirements, including the timeliness and quality of reports, relate to contract and supplier report submissions due by 30 April 2026. Data presented is as of 31 May 2026, to allow a month for the Ministry of Defence (MOD) and SSRO to review the reports and establish their quality. Where available, time series data is also shown from 1 May 2018, when compliance data was first collected in the reporting system.
Data for both QDCs and QSCs are included in these statistics and are reported separately where specified. Some QDCs/QSCs are framework contracts, with the individual contracts let under those framework contracts (sometimes referred to as call-off contracts, tasks, or orders) also being QDCs/QSCs, and so these have been counted as separate QDCs/QSCs within the statistics.
All time-series data within the first four sections of the bulletin is reported using the date a contract became a QDC/QSC (the initial reporting date[1]), unless otherwise specified. Data in the compliance section uses the report due date. Defence contractors are required to submit their initial contract reports within a month of this date. This statistical bulletin reports on the latest agreed position for each QDC/QSC.
The methodology for each section in the bulletin is described below.
[1] Either the date the contract was entered into, or if it is a contract brought into the regime following an amendment, the date of the amendment.
Number, duration and SME involvement
While the bulletin reports on QDCs/QSCs which have submitted contract reports, the total number of QDCs/QSCs notified to the SSRO is measured by the amount of QDCs/QSCs (that are not currently marked as a potential QDC/QSC) added to DefCARS, regardless of whether reports have been submitted or not for that contract.
In this analysis a completed contract is defined as a contract with a submitted Contract Completion Report (CCR). This is required six months after the contract completion date and is the first point at which a statutory report submission confirms that a contract has completed. The submission of this report is considered as a more robust method of establishing when a contract completes compared to using the estimated contract completion dates submitted in each report, which may change during the life of the contract. However, there may be a lag of up to six months (or more if the report submission is late) before a contract is classified as complete, and the latest financial year presented in the statistics may not reflect all contracts that have actually completed in that period. Whilst the receipt of the CCR (within six months after contract completion) is used as the indicator for when a contract has completed, the financial year in which the contract completed is sourced from the contract completion date in the CCR. Contracts that have not submitted a CCR are defined as ‘active’. This may include some contracts which have completed but have not yet submitted a CCR.
When a contract is completed, it is likely that no further contract update reports will be submitted and the contract data submitted through statutory reports will remain relatively unchanged, unless corrections to these reports are provided. Contract Cost Statements (CCS) are submitted after the CCR and may update some of the reported data, but these are unstructured reports and so are not used in the analysis. Some contracts had erroneously submitted CCRs and so are still counted as active contracts in this analysis, where the SSRO is made aware of the error.
Contract duration figures reflect the latest reported expected or actual duration at the reporting date. The estimated contract duration presented is the time between the date the contract became a QDC/QSC, and the expected, or actual where available, contract completion date. Average contract duration is an arithmetic mean of all QDCs/QSCs within that financial year. Contract duration data is sourced from the latest of the Contract Pricing Statement (CPS), Contract Notification Report (CNR), On-demand Contract Reporting Plan (ODCRP), Quarterly Contract Report (QCR), Interim Contract Report (ICR) or CCR.
The SME status of a contractor or sub-contractor uses data as submitted by the contractors themselves; the SSRO has not assessed the data submitted to determine whether the contractor or sub-contractor was correct to conclude it falls within the definition of SME as set out in Regulation 2 of the Single Source Contract Regulations 2014. Data on the SME status is sourced from the latest of the CPS, CNR, ODCRP, QCR, ICR or CCR.
The number of unique contracting companies is reported using the registered company details provided by contractors in their latest available report. These contracting companies are then grouped into their respective parent company using either data matched from the MOD’s Contracting, Purchasing & Finance (CP&F) system, or where unavailable using the Global Ultimate Owner (GUO) from Bureau Van Dijk’s Orbis database. The GUO considers whether a company controls a majority (greater than 50.01 per cent) of the voting rights of the company in question. Where a company has no single entity with a controlling majority, the company itself is considered the GUO of the corporate group.
The number of contracting companies or GUOs may be revised from previous bulletins due to new contracts (and hence contractors) being included in the analysis where reports are submitted late, or due to changes in ownership in contracting companies/GUOs.
The sub-contract data is sourced from the latest report containing information on subcontracts for the whole contract (the latest of the CNR, ICR or CCR). From the 2020/21 bulletin onwards, QCRs are no longer used to source sub-contract data, as these reports only require data on sub-contracts entered into in the reporting period covered by the QCR, or the following quarterly period, and therefore don’t represent the total sub-contracting picture within a contract.
Statistics on the number of components were added in the 2025/26 bulletin, following feedback from stakeholders. Component data is sourced from the latest report containing information on the component price (the latest of the CIR, ODCRP, ODCPS, ICR or CCR). The components are linked to the parent QDC/QSC using data notified to us by the contractor themselves.
Price and pricing methods
The contract price and pricing method statistics reflect the estimated price, at the latest time of agreement (either the date the contract became a QDC/QSC, or the date of the latest pricing amendment). The total contract price may sometimes include costs incurred before an amended contract becomes a QDC/QSC (‘sunk costs’). Pricing data is sourced from the latest submitted CPS, CNR, QCR, ICR or CCR.
The total price of all contracts in these statistics includes the price of all QDCs and QSCs, meaning that QSC prices are counted both within the ‘parent’ QDC price and separately, representing the total price of all contracts subject to the Single Source Contract Regulations.
Amendments to the Regulations took effect on 1 April 2024, introducing new alternative pricing methods that may in particular circumstances be used to price QDCs/QSCs. Due to the low number of contracts currently reporting information under these alternative pricing methods, the data has been grouped into a single ‘Alternative Pricing’ group, including those reported under Regulation 19G ‘Aggregation of Components’. In addition, some of these pricing methods allow the contract price to be reported where costs and profits are not determined and identified separately for the purposes of pricing the contract.
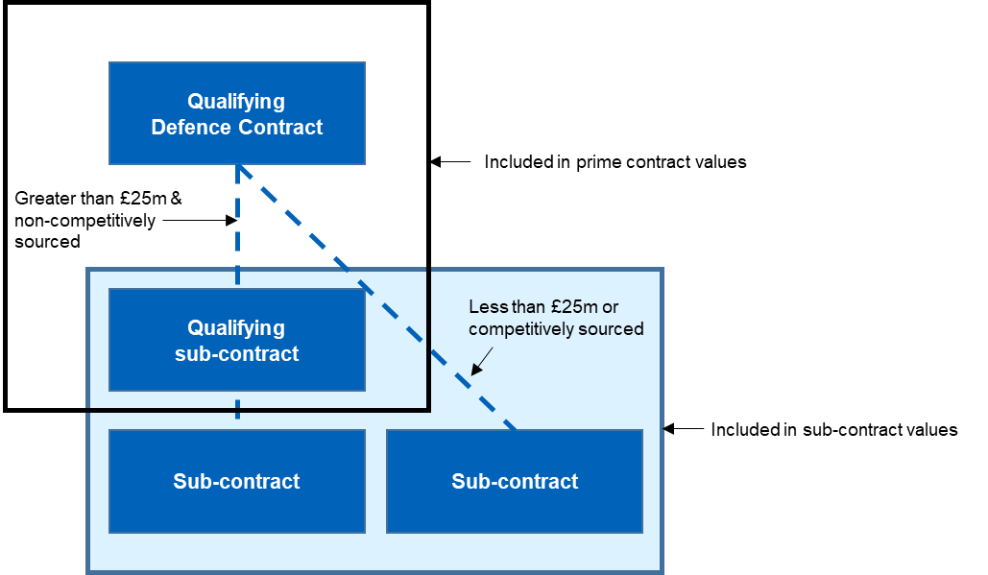
QSCs are included within the sub-contracting numbers and price data in this analysis. It is also possible for a sub-contract to a QSC to also become a QSC, and this would be included in both the total price of all contracts, as well as the sub-contracting figures (see Figure 31).
Figure 5 reflects the actual or intended sub-contracts with a value of £1 million or more reported by contractors. This analysis as such may not represent the entirety of sub-contracts involved in the delivery of QDCs/QSCs. The price data in Figure 13 presents the sum of the latest estimated or actual sub-contract prices for sub-contracts with a value of £1 million or more. Contractors are required to submit the expected price of sub-contracts agreed for pricing purposes, which may not reflect the actual price at the end of the contract.
Until September 2019, only the highest value 20 sub-contracts with a value of £1 million or more were required to be reported within the contract reports. Since September 2019, the restriction for the top 20 sub-contracts has been removed, so all sub-contracts with a value of £1 million or more must be reported. The analysis in Figure 5 showing individual sub-contract numbers introduces a new methodology that now uses all sub-contracts reported in contractors’ reports, which will either be the top 20 sub-contracts with a value of £1 million or more, or all sub-contracts with a value of £1 million or more, depending on whether the report was submitted before or after September 2019. Some contractors provide details of sub-contracts below £1 million, which are still included in the analysis.
The sub-contract price statistics in Figure 13 reflect the latest estimated total price of sub-contracting within QDCs/QSCs. From the 2020/21 bulletin onwards, Figure 13 now uses the ‘Total price of the QDC/QSC that is attributable to sub-contracts’ field in DefCARS, rather than the sum of sub-contracts over £1m, following a review of the data quality of this field. Figure 13 therefore includes sub-contracts with a value of less than £1 million, and only includes the amount of the sub-contracts that are attributable to the QDC/QSC.
Statistics on the price of components and the contract price by price band were added in the 2025/26 bulletin, following feedback from stakeholders.
Figure 31: How QDC, QSC and sub-contracts have been treated in the analysis
Profit
The contract profit rate data in this section is sourced from the latest available CPS. The majority of contract profit rate statistics reflect the agreed position at the latest time of agreement (either the date the contract became a QDC/QSC, or the date of the latest pricing amendment if an on-demand CPS has been submitted) and does not necessarily represent the profit that will be achieved once the contract is complete. This may differ from the profit information reported in the ‘Price and pricing methods’ section, which can be sourced from more up-to-date reports.
The mean contract profit rates are an arithmetic mean of the reported contract profit rates reported by QDCs/QSCs within that financial year. Where one of the profit rate steps does not apply (as is the case with the incentive adjustment for many QDC/QSCs), this is treated as a zero in the calculations for averages.
Contracts that have agreed the government owned contractor rate (GOCR) with the MOD have been excluded from all the profit rate analysis, as have contracts that did not provide any profit data, or where there were data quality concerns with the data provided.
From January 2022 to March 2024, contracts with a pricing amendment that changes the contract profit rate only need to enter the overall contract profit rate into standard DefCARS fields in an ODCPS, leaving the six steps blank. These contracts are excluded from the profit rate step analysis (all analysis in the ‘Profit’ section except Table 5). Additionally, the amendments to the Regulations from 1 April 2024 introduced changes to how profit data is submitted if a contract includes components (a component of a contract means a part of a contract that is to be treated distinctly from other such parts in determining the price payable under a contract). Contractors may need to provide the profit rate step information at a component level, rather than at the overall contract level. The SSRO announced in a previous bulletin that we would start to incorporate this component level information when reporting the profit rate step statistics in this section, subject to a data quality review. On a review of the data this year, it was found that there is some further investigation to complete around the use of the component level profit rate step data for the purposes of reporting in this statistical bulletin, and it has been decided to continue to exclude this component level data from the analysis. The SSRO will continue to monitor and review this data, and will include it in the statistics when appropriate.
Amendments to the Single Source Contract Regulations that took effect on 1 April 2024 also resulted in the SSRO funding adjustment and POCO adjustment no longer applying to contracts that became QDCs/QSCs on or after 1 April 2024. These are still included in the statistics to enable historic comparisons, but for 2024/25 contracts onwards these show as zero or not applicable.
Upper quartile and lower quartile values were introduced from 2018/19 onwards in the 2019/20 statistics bulletin and so figures for previous financial years are not reported in the accompanying databook. Statistics on the average profit rates by pricing method were added in the 2025/26 bulletin, following feedback from stakeholders.
Contracts can employ multiple pricing methods, and so QDCs/QSCs in Figure 17 have been allocated to a ‘primary’ pricing method if more than 75 per cent of the contract price is reported against that pricing method. Where there is no one pricing method with more than 75 per cent of the contract price, this is classified as ‘mixed’. Some pricing methods have been grouped due to the similar ways in which profit risk sharing is treated by these methods. Note that this differs from how contracts are allocated to pricing methods in the ‘Price and pricing methods’ section, where contracts are allocated to a pricing method if any proportion of the contract is attributed to a pricing method.
Outturn price in completed contracts
When a contract is completed, it is likely that no further contract update reports will be submitted in which case the contract data submitted through statutory reports will remain relatively unchanged, unless corrections to these reports are provided. Contract Cost Statements are submitted after the CCR and may update the reported data, but these are unstructured reports and so are not used in the analysis.
The ‘Number, duration and SME involvement’ methodology section explains how completed contracts are defined in this analysis. All actual and forecast data used in the completed contracts statistics reflect the position at contract completion as reported in the CCR. The estimated costs and profit within this section are also sourced from the CCR and reflect the latest agreed price, which may be the price when the contract was entered into or, if it has been amended, the price following the most recent amendment.
The variances reported within the completed contract statistics have been calculated between the estimated price at the latest time of agreement (either the date the contract became a QDC/QSC or the date of the latest amendment) and the actual and forecast price at the contract completion date. A contractor can still report some forecast costs when submitting its completion reports (up to 5 per cent of the price without an explanation, or more if an explanation is given), so the actual and forecast price may not reflect the final outturn price. It also does not reflect any final price adjustments or TCIF adjustments. The underlying cost and profit data has been rounded to three decimal places (in line with the SSRO’s Reporting Guidance on entering this data in DefCARS) before calculating the percentage variance.
Compliance
All analysis in this section defines the financial years as being 1 May to 30 April each year (’Reporting Period’). Contractors have one month after the contract becomes a qualifying contract to submit their reports. For example, a contract entered into on 30 March 2026 will have an initial report due date of 30 April 2026 and therefore the initial report would be included in the analysis for the 2025/26 financial year.
This bulletin analyses reports submitted on or before the cut-off date of 31 May 2026. It considers:
- QDCs and QSCs entered into between 1 April 2015 and 31 March 2026 and notified to the SSRO by 30 April 2026;
- associated contract and supplier reports that were due for submission between 1 May 2018 and 30 April 2026 (compliance-related data was only available in DefCARS for reports submitted from 1 May 2018); and
- all reports submitted and reviewed for compliance issues up to 31 May 2026 to provide the SSRO and MOD time to review and resolve issues within these reports.
The compliance analysis refers to three types of contract reports:
- initial reports include the Contract Pricing Statement (CPS), the Contract Reporting Plan (CRP) and the Contract Notification Report (CNR), known collectively as the Contract Initiation Report (CIR);
- update reports include the Interim Contract Report (ICR), the Quarterly Contract Report (QCR), and any on-demand report CPS, CRP and ICR; and
- completion reports include the Contract Completion Report (CCR) or Component Completion Report (CompCR), Contract Costs Statement (CCS) and any on-demand CCS.
The analysis also refers to two types of supplier report:
- overheads reports include the Qualifying Business Unit Estimated Cost Analysis Report (QBUECAR), the Qualifying Business Unit Actual Cost Analysis Report (QBUACAR), the Estimated Rates Agreement Pricing Statement (ERAPS), the Estimated Rates Claim Report (ERCR), the Actual Rates Claim Report (ARCR) and the Rates Comparison Report (RCR) which is only triggered by a written notice from the Secretary of State; and
- strategic reports include the Strategic Industry Capacity Report (SICR) and the Small or Medium Enterprises (SME) Report.
For MOD enforcement action, the analysis includes Compliance Notices which the MOD has notified us of being issued during 2025/26 (i.e. 1 April 2025 to 31 March 2026).
Timeliness
Analysis of the timeliness of report submissions uses the report due date to group the analysis by financial year. This date is according to the contractor’s own reporting plans and report submissions, unless they have not yet been submitted. In some cases, adjustments may be made to these dates to correct for known errors. Reports submitted with blank report due dates will not be included in the analysis as DefCARS cannot determine which financial year the report relates to. Where reporting plans have not yet been submitted, the SSRO estimates the report due dates where possible, using information available when the contracts are notified to the SSRO.
Overheads reports may be required for a Qualifying Business Unit (QBU) in some years and not others, depending on whether the ongoing contract conditionand QBU thresholdare met. Please refer to the SSRO’s Supplier Reporting Guidance for more information on these thresholds. The SSRO does not have independent access to the information required to assess whether these requirements are met for a QBU and is dependent on notifications from the MOD and the contractor. The analysis is therefore subject to some assumptions made by the SSRO about submissions that are expected when it is aware of certain conditions having been met.
Quality
Analysis of the quality of report submissions also uses the report due date to group the analysis into the relevant financial year.
Issues raised on a report by the MOD or the SSRO only affect the quality indicator if they relate to reporting requirements; those relating to pricing matters are excluded from the analysis. When an issue is raised, there is the ability to mark it as not affecting the compliance rating, for various reasons. Where this has occurred, the issue is excluded from the analysis and does not count as an issue raised for compliance purposes.
If an issue arises on a CIR submission and it is applicable to each of the three initial submissions (the CPS, CNR and CRP), it would be counted as three individual issues raised. If it is not applicable to all three initial reports, a mapping exercise would be undertaken to identify which of the initial three reports the issue relates to. Due to the large number of issues raised, this would not be done on a case-by-case basis and would instead be mapped using the broad information category the issue has been assigned to. If an issue is raised that relates to a field only required in the CPS, for example, this would only count as one issue, and only one of the three initial reports would be assessed as not meeting the statutory requirements. A similar process is undertaken for QBUCARs, where an issue could be raised on data relating to either the QBUECAR or the QBUACAR.
Issues raised where the due date is blank are not included in the analysis as we cannot determine the financial year the issue is attributable to.
Commencing 2025/26, we have changed our KPI to be based upon the per cent of reports that remain with reporting issues outstanding one month following the end of the twelve-month reporting period. This KPI is to be called ‘Reports with active issues’ with a target set at less than 5 per cent. Within this KPI we have made adjustments that have excluded active issues where contractors have responded but the issue has not yet been closed, excluded active issues raised within the two weeks prior to the cut-off date, and included closed issues if the reason for closure was due to a lack of response.
This changes the KPI to one that focuses on whether contractors have taken steps to improve the quality of submissions subsequent to any issues being identified. Overall, this presents a better measure of contractor engagement with the reporting and compliance processes.
Data quality
Accuracy and reliability
The estimated contract prices, costs, duration, sub-contracts and profit rates reported are those used for contract pricing purposes and may not reflect the outturn costs and profit of the contract once it is completed. Where a contract has submitted a Contract Completion Report, the estimated price, cost and profit rate reported in all analysis (other than the ‘Outturn price in completed contracts’ section) are still the estimates as at the latest time of agreement, rather than the outturn costs and profits.
The SSRO monitors the extent to which report submissions comply with the reporting requirements under Section 36(2) of the Defence Reform Act 2014. The Compliance section of this bulletin provides details on the data quality of report submissions with respect to the extent they comply with the reporting requirements. The SSRO’s compliance review function does not involve providing assurance that individual contracts have been priced in accordance with statutory requirements, nor is it an audit of individual submissions. The MOD also carry out reviews of the data quality contained within these reports, in line with their own commercial guidance. It is important to note that, whilst reviews of the data do take place, reviews may not have taken place on all the data by both organisations at the time of production of this bulletin. Data is as reported by contractors unless there are significant data quality issues (see ‘Data adjustments’ below).
Data revisions
Where data is revised or corrected from a previously published statistic, this will be marked with an ‘[r]’ in tables and a superscript ‘r’ in charts.
Prior to the 2025/26 bulletin, the QDC statistics were labelled as revised whenever a data point had changed between bulletins due to the submission of new or corrected reports. However, this resulted in a high volume of revisions throughout each bulletin which did not provide a clear message to users on the status or quality of the data.
The QDC statistics present the latest reported data from contracts and are therefore expected to change regularly (i.e. when updated or corrected contract reports are submitted describing the latest contract position, or highlighting contract extensions or amendments). Statistics may be subject to change until contract completion reports are submitted, which can be years after the contract started. The statistics represent a snapshot in time, and are correct as of data extraction and so are not treated as provisional. As a result, it is expected that time series statistics will differ from bulletin to bulletin. Similarly, compliance statistics are not expected to be static as reports can be submitted late or suppliers can provide corrected or updated reports with new data. As the statistics are based on an administrative source there will be a degree of inherent inaccuracy in the data.
Given the latest contract and compliance data is reported in each bulletin, expected changes between data points in each bulletin are no longer labelled as revised, with the exception of Figure 1. Statistics on the number of QDCs/QSCs are labelled as revised when a new contract is reported late, where this is new contract report data that was not available at the time of publication. If a correction report highlights that the financial year the contract became a QDC has been altered, this is also highlighted as revised in the statistics on numbers of QDCs/QSCs by financial year. Additional statistics associated with any late reported contracts will not be labelled as revised.
Where errors are found which have a significant impact on the utility of the statistics, the SSRO may correct these by reissuing the publication, outside of the scheduled statistical release programme. Where this happens, the reason and impact of the revision will be given. Minor errors will also be corrected but may be timed to coincide with the next annual release of the publication.
Data adjustments
All data is as reported by defence contractors, except in circumstances where there are known, and significant, data quality issues. Where there are issues, the data has been amended to ensure the statistics are not misleading. In summary, the following adjustments were made in a small number of cases:
- some dates the contract became a QDC/QSC were amended, if the reported date fell within a different financial year to the known date the contract became a QDC/QSC;
- some contract/sub-contract prices were amended, for example where these were reported in different units or currency; and
- where the latest contract report did not provide the required data, a previous contract report was used if that did contain the relevant data.
Additionally, where contractors have entered monetary values in currencies other than pounds sterling, values are converted using the exchange rates published by the Bank of England as of the first day of the month in which the contract became a QDC/QSC.
For the Compliance section of the bulletin, some adjustments have been made in circumstances where there are known, and significant, data quality issues so that the analysis is not misleading. Adjustments were made in a small number of cases, for example where some on-demand report requests have been made without an updated CRP.
Additionally, we have manually added to the analysis where the contractor submitted a report outside of the DefCARS system. Mostly, this was for Strategic Industry Capacity Reports (SICRs), which cannot be submitted in DefCARS.
Rounding
Totals are calculated on unrounded figures, before being rounded for presentational purposes. Therefore some totals may not sum due to rounding.
Commercial sensitivity and disclosure control
Due to the commercial sensitivity of this data, the SSRO does not release any information that will enable identification of individual contracts or contractors included within the analysis.
Where publication of a particular data point may risk anonymity, the data will be suppressed and marked with a ‘[c]’ in tables and a superscript ‘c’ in charts. Additional cells may also need to be suppressed to prevent unsafe cells being determined indirectly from the totals. Detailed categories of data may also be reported at a higher level, or breakdowns removed, if they present a potential risk to anonymity.
For more information on the SSRO’s handling of commercially sensitive information, see the SSRO’s statement on its website.
Glossary
Allowable Costs: A contractor’s costs (which include those already incurred and those which are anticipated) are Allowable Costs in a QDC or QSC to the extent they are appropriate, attributable to the contract and reasonable in the circumstances.
Alternative Pricing: On 1 April 2024 amendments to the Regulations took effect, allowing for new alternative pricing methods to be used in QDCs/QSCs. These are intended to be used in circumstances where application of the pricing formula may not be possible or because a fair price can be satisfactorily established by other means. This includes, for example, where prices are already regulated or where there is a market price which can act as a reference (such as off the shelf software). The number of contracts utilising these alternative pricing methods to date is low, and so they have all been grouped into an ‘alternative pricing method’ group for the purposes of these statistics, including those reported under Regulation 19G ‘Aggregation of Components’.
Component: A component of a contract is a part of a contract that is treated distinctly from other such parts in determining the price payable under a contract. For example, a component can be created where a part of a contract uses a different contract pricing method or has a different contract profit rate.
Contract completion date: Provided by the contractor, it may be the earlier of the date on which the contractor completes all obligations in the contract whereby the contractor becomes entitled to final payment, or the termination of the contract.
Contract price: the price payable under a QDC or QSC, determined in accordance with one, or a combination, of:
- the default pricing method, applying the formula:
Price = (Contract Profit Rate x Allowable Costs) + Allowable Costs, and/or
- an alternative pricing method, in accordance with the relevant provision (contained in Regulations 19A – 19G).
Where a QDC or QSC contains components, the price payable is determined in accordance with:
- Regulation 19G (aggregation of components), or
- The sum of the prices payable for each component
Contract profit rate (CPR): When agreeing the contract profit rate, contractors and the MOD must follow a process set out in section 17(2) of the Act and Regulation 11 of the Single Source Contract Regulations 2014.
Contract value: As determined under regulation 5 of the Single Source Contract Regulations 2014. The contract price and the contract value may be the same but in determining the contract value the contracting authority must take account of contract options which may not be included in the contract price and the likelihood of them being exercised.
Costs indistinguishable from profits: From 1 April 2024, contracts may be priced using alternative pricing methods in some cases where costs and profits may not be determined or identified separately for the purposes of pricing the contract, and hence the Allowable Costs and profit cannot be reported separately.
Date became a QDC/QSC: Either the date the contract was entered into, or if it is a contract brought into the regime following an amendment, the date of the amendment.
Qualifying Defence Contract (QDC): A non-competitively procured defence contract entered into on or after 18 December 2014 with a value of £500 million or more (if entered into prior to 31 March 2015), or £5 million or more (if entered into on or after 31 March 2015). Non-competitively procured contracts with a value of £5 million or more and entered into before 18 December 2014, and competitively procured contracts with a value of £5 million or more, may become QDCs if they are amended without competition on or after 18 December 2014 and the parties agree to them being brought within the regulatory framework. The Single Source Contract Regulations 2014 specifies the circumstances in which a contract that meets the requirements for being a QDC is not a QDC.
Qualifying Sub-contract (QSC): A sub-contract that has been assessed as meeting the requirements to be a QSC, requiring notice of the assessment to be given in writing to the sub-contractor and the Secretary of State (or an authorised person). The requirements for a sub-contract to be a QSC include that it is not the result of a competitive process, is valued at £25 million or more and delivers anything for the purposes of a QDC or another QSC. The Single Source Contract Regulations 2014 specifies the circumstances in which a contract that meets the requirements for being QSC is not a QSC.
Time of agreement: Either the date on which a QDC/QSC is entered into, the date of an amendment it if is a QDC/QSC by amendment, or if the price payable is re-determined, the date of that redetermination.
Further information
The SSRO is committed to engaging with stakeholders to improve these statistical releases.
If you would like to get in touch, please email us at helpdesk@ssro.gov.uk. The SSRO also welcomes feedback through the regular engagement it conducts with stakeholders.